29
/
en
AIzaSyAYiBZKx7MnpbEhh9jyipgxe19OcubqV5w
April 1, 2024
247343
Spain
ESP
true
2
1
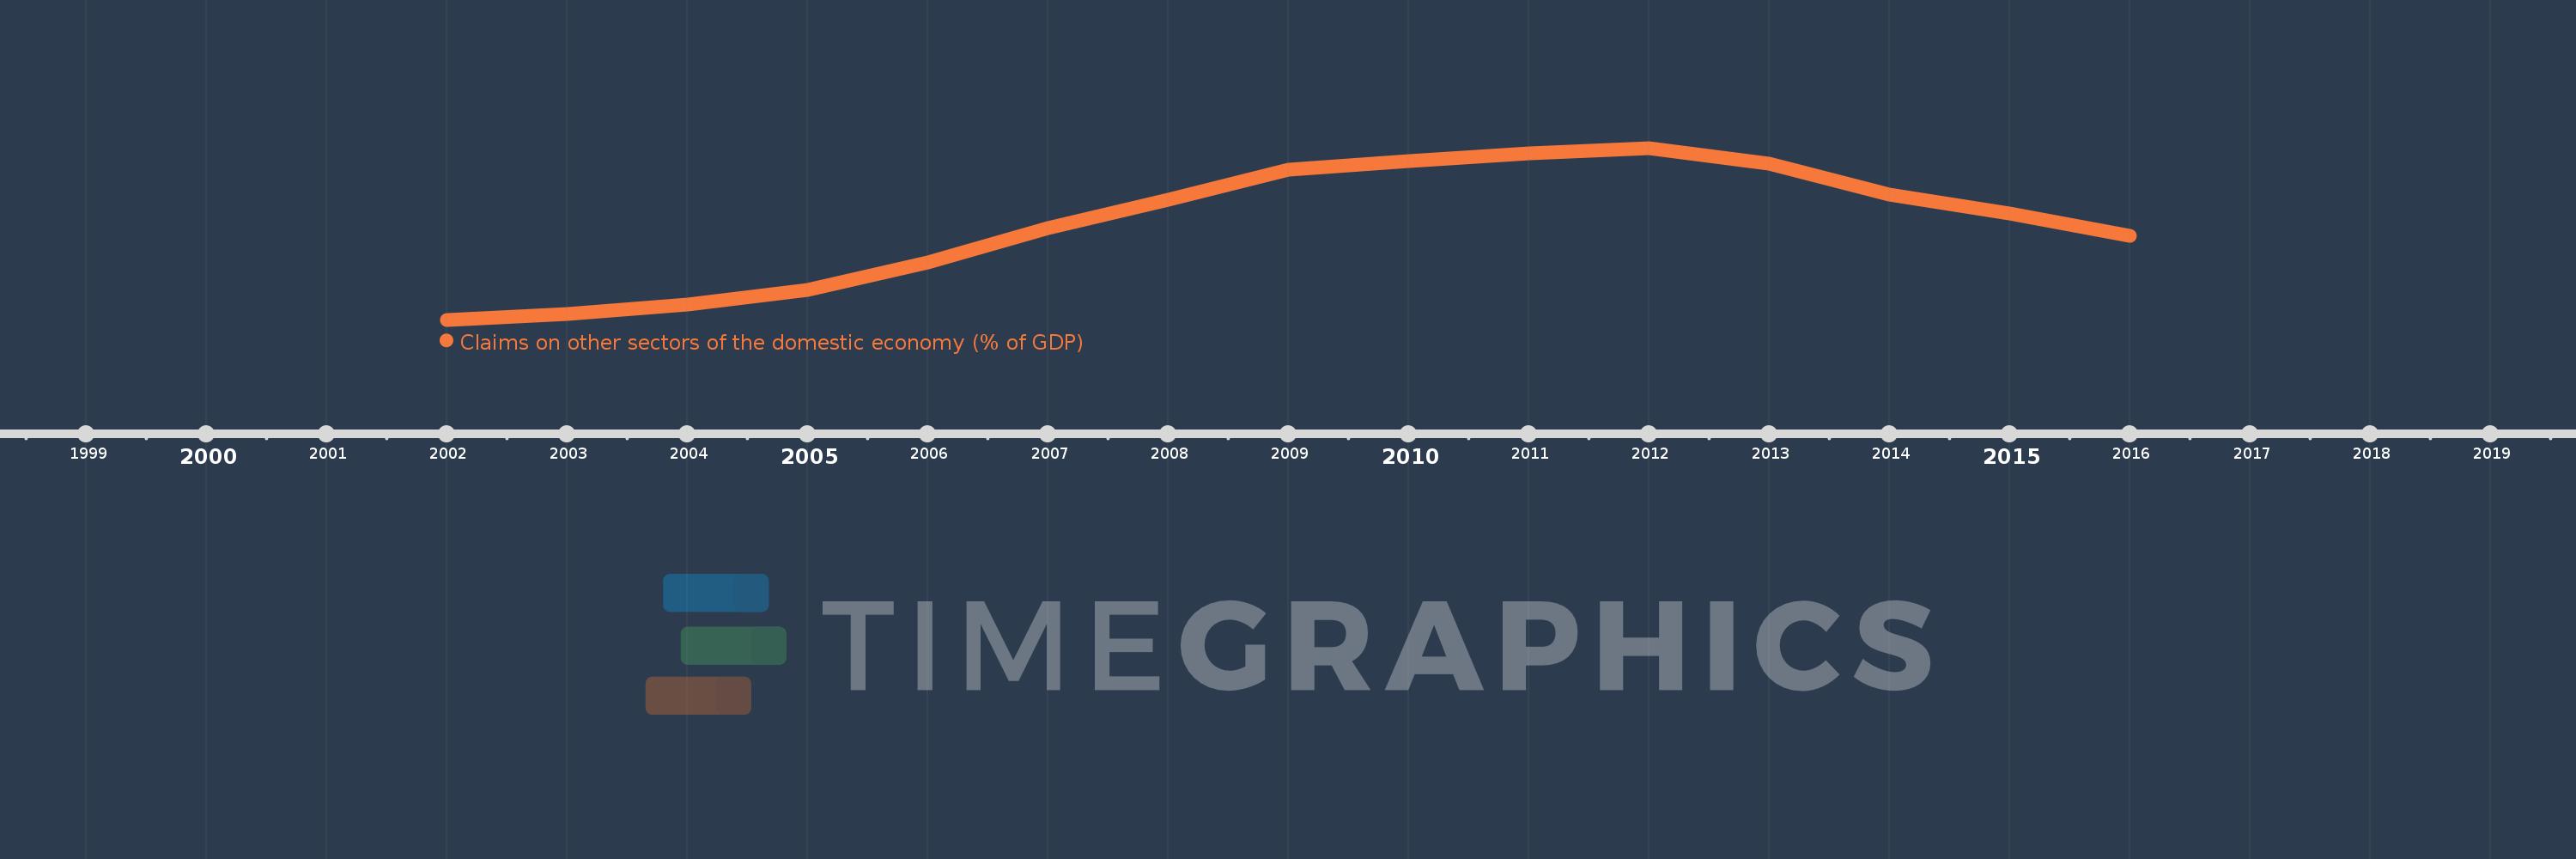
Claims on other sectors of the domestic economy (% of GDP)
2016,2015,2014,2013,2012,2011,2010,2009,2008,2007,2006,2005,2004,2003,2002
This statistics in other country:
Timeline:
This timeline shows a graph from 2002 to 2016 of Spain. No data until 2001. Number of actual observations by date: 15.
Source name:
World Development Indicators
Source organization:
International Monetary Fund, International Financial Statistics and data files, and World Bank and OECD GDP estimates.
Categories, topics:
Financial Sector
Last updated:
apr 23, 2017
Indicators value changes by year
Minimum:
103.913
jan 1, 2002
Maximum:
233.451
jan 1, 2012
At the date of observation
Value
Absolute change
Change from previous value
jan 1, 2002
103.913
+103.913
0.0%
jan 1, 2003
108.05
+4.137
3.98%
jan 1, 2004
115.35
+7.3
6.76%
jan 1, 2005
126.554
+11.205
9.71%
jan 1, 2006
147.066
+20.511
16.21%
jan 1, 2007
173.313
+26.247
17.85%
jan 1, 2008
194.454
+21.141
12.2%
jan 1, 2009
216.836
+22.382
11.51%
jan 1, 2010
223.73
+6.895
3.18%
jan 1, 2011
229.555
+5.824
2.6%
jan 1, 2012
233.451
+3.896
1.7%
jan 1, 2013
221.646
-11.805
-5.06%
jan 1, 2014
198.235
-23.411
-10.56%
jan 1, 2015
184.185
-14.05
-7.09%
jan 1, 2016
167.361
-16.824
-9.13%
Ranking of countries by current statistics by years


Comments: