29
/
en
AIzaSyAYiBZKx7MnpbEhh9jyipgxe19OcubqV5w
April 1, 2024
202649
Mozambique
MOZ
true
2
1
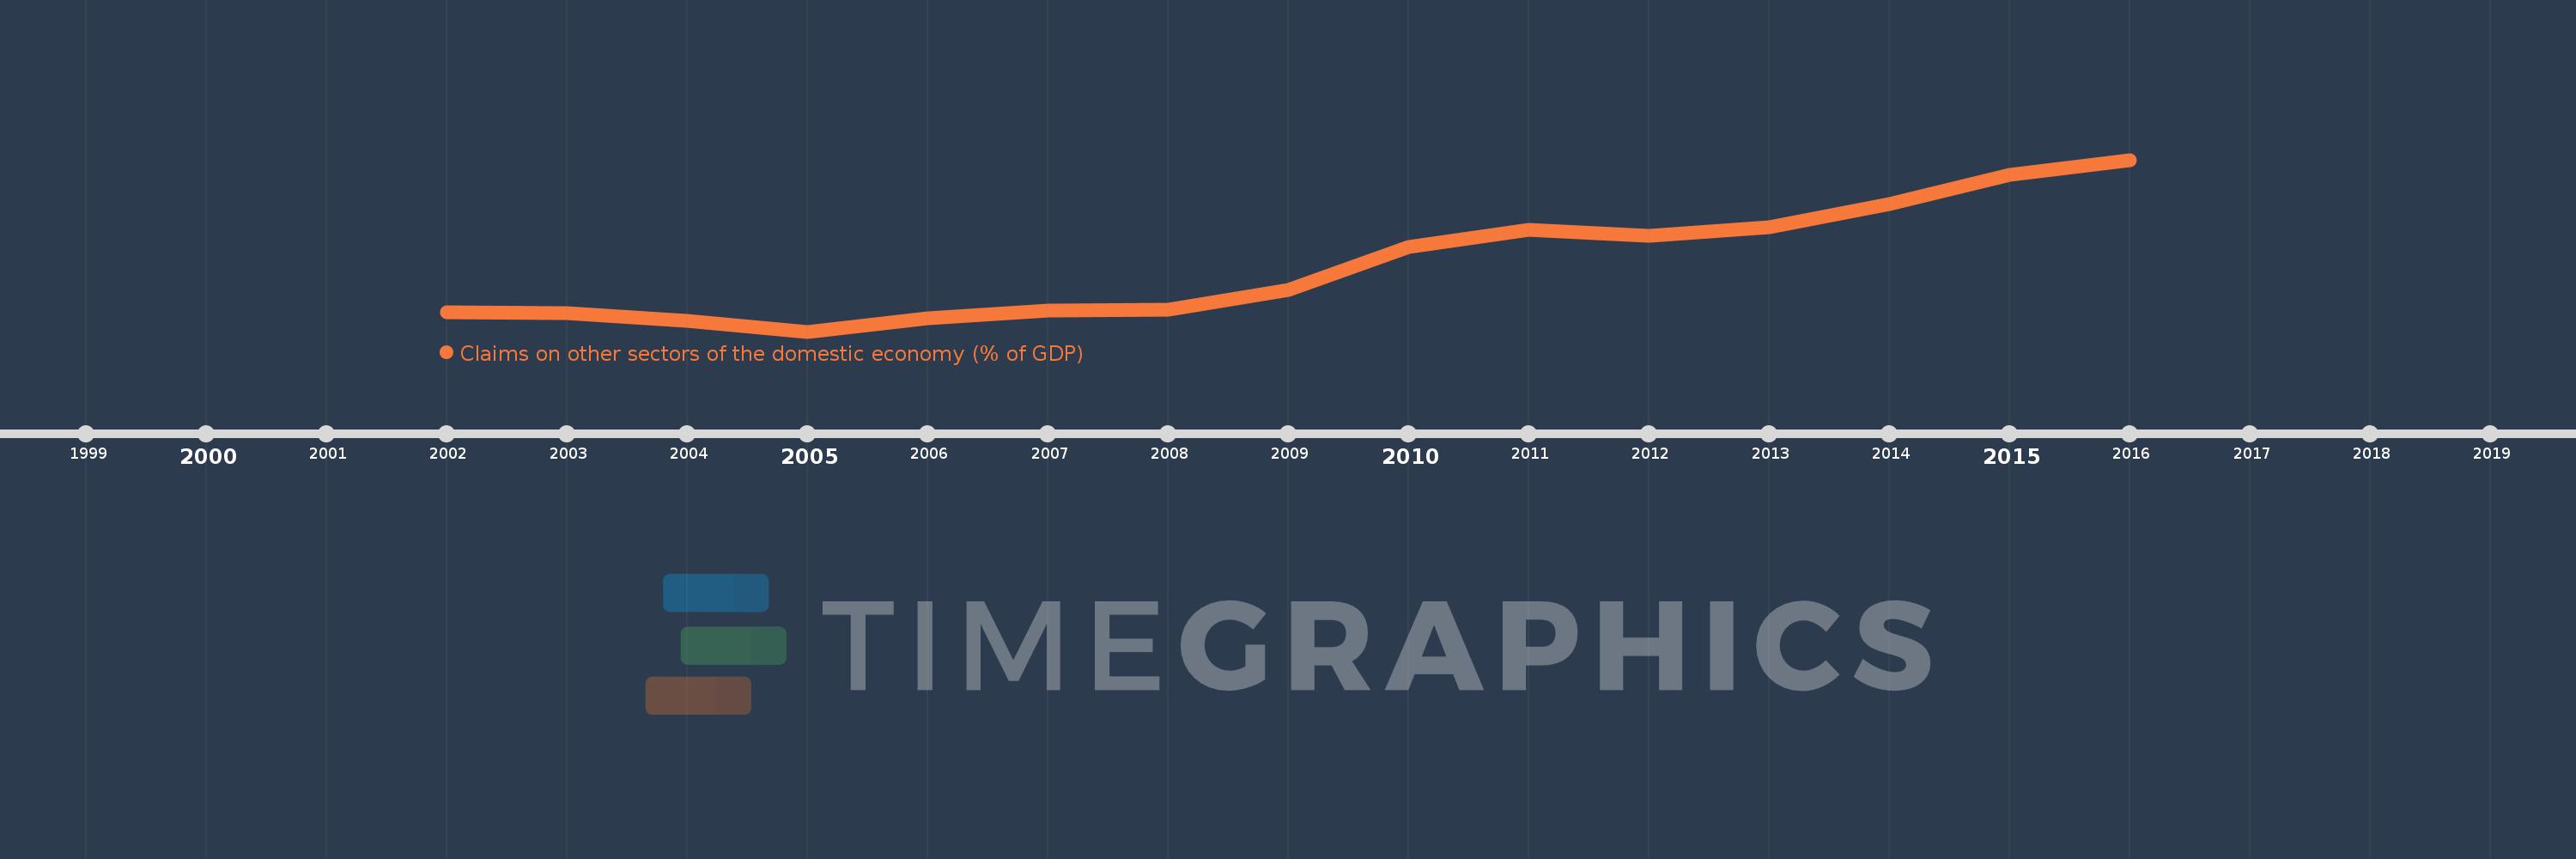
Claims on other sectors of the domestic economy (% of GDP)
2016,2015,2014,2013,2012,2011,2010,2009,2008,2007,2006,2005,2004,2003,2002
This statistics in other country:
Timeline:
This timeline shows a graph from 2002 to 2016 of Mozambique. No data until 2001. Number of actual observations by date: 15.
Source name:
World Development Indicators
Source organization:
International Monetary Fund, International Financial Statistics and data files, and World Bank and OECD GDP estimates.
Categories, topics:
Financial Sector
Last updated:
apr 23, 2017
Indicators value changes by year
Maximum:
39.209
jan 1, 2016
At the date of observation
Value
Absolute change
Change from previous value
jan 1, 2002
12.191
+12.191
0.0%
jan 1, 2003
12.155
-0.036
-0.29%
jan 1, 2004
10.687
-1.468
-12.08%
jan 1, 2005
8.815
-1.872
-17.52%
jan 1, 2006
11.215
+2.401
27.24%
jan 1, 2007
12.546
+1.331
11.87%
jan 1, 2008
12.757
+0.211
1.68%
jan 1, 2009
16.125
+3.368
26.4%
jan 1, 2010
23.792
+7.667
47.55%
jan 1, 2011
26.787
+2.995
12.59%
jan 1, 2012
25.741
-1.046
-3.9%
jan 1, 2013
27.205
+1.464
5.69%
jan 1, 2014
31.45
+4.245
15.61%
jan 1, 2015
36.607
+5.157
16.4%
jan 1, 2016
39.209
+2.602
7.11%
Ranking of countries by current statistics by years


Comments: