29
/
en
AIzaSyAYiBZKx7MnpbEhh9jyipgxe19OcubqV5w
April 1, 2024
175109
Latvia
LVA
true
2
1
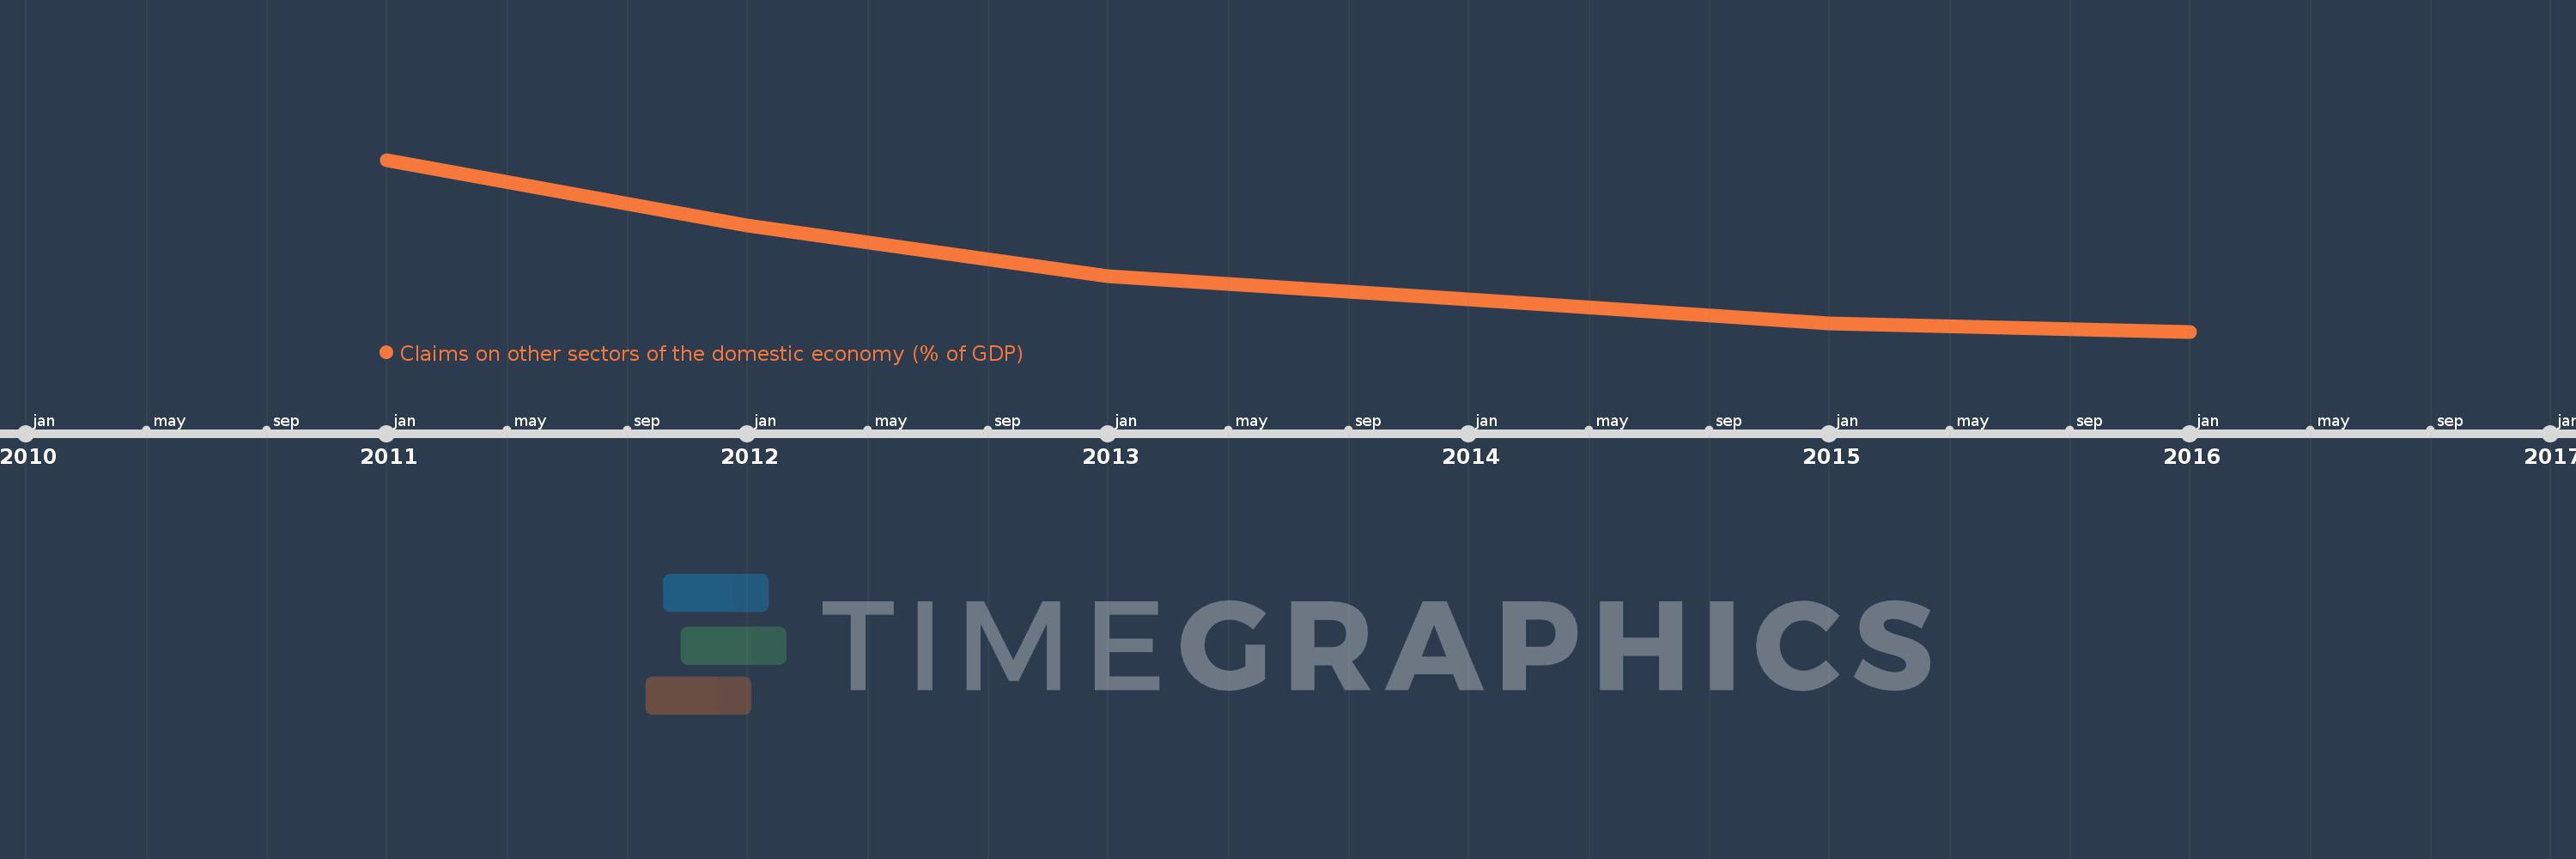
Claims on other sectors of the domestic economy (% of GDP)
2016,2015,2014,2013,2012,2011
This statistics in other country:
Timeline:
This timeline shows a graph from 2011 to 2016 of Latvia. No data until 2010. Number of actual observations by date: 6.
Source name:
World Development Indicators
Source organization:
International Monetary Fund, International Financial Statistics and data files, and World Bank and OECD GDP estimates.
Categories, topics:
Financial Sector
Last updated:
apr 23, 2017
Indicators value changes by year
Minimum:
54.077
jan 1, 2016
Maximum:
101.205
jan 1, 2011
At the date of observation
Value
Absolute change
Change from previous value
jan 1, 2011
101.205
+101.205
0.0%
jan 1, 2012
83.116
-18.089
-17.87%
jan 1, 2013
69.24
-13.875
-16.69%
jan 1, 2014
62.993
-6.248
-9.02%
jan 1, 2015
56.32
-6.673
-10.59%
jan 1, 2016
54.077
-2.243
-3.98%
Ranking of countries by current statistics by years


Comments: