29
/
en
AIzaSyAYiBZKx7MnpbEhh9jyipgxe19OcubqV5w
April 1, 2024
39757
IDA total
IDA
false
2
1
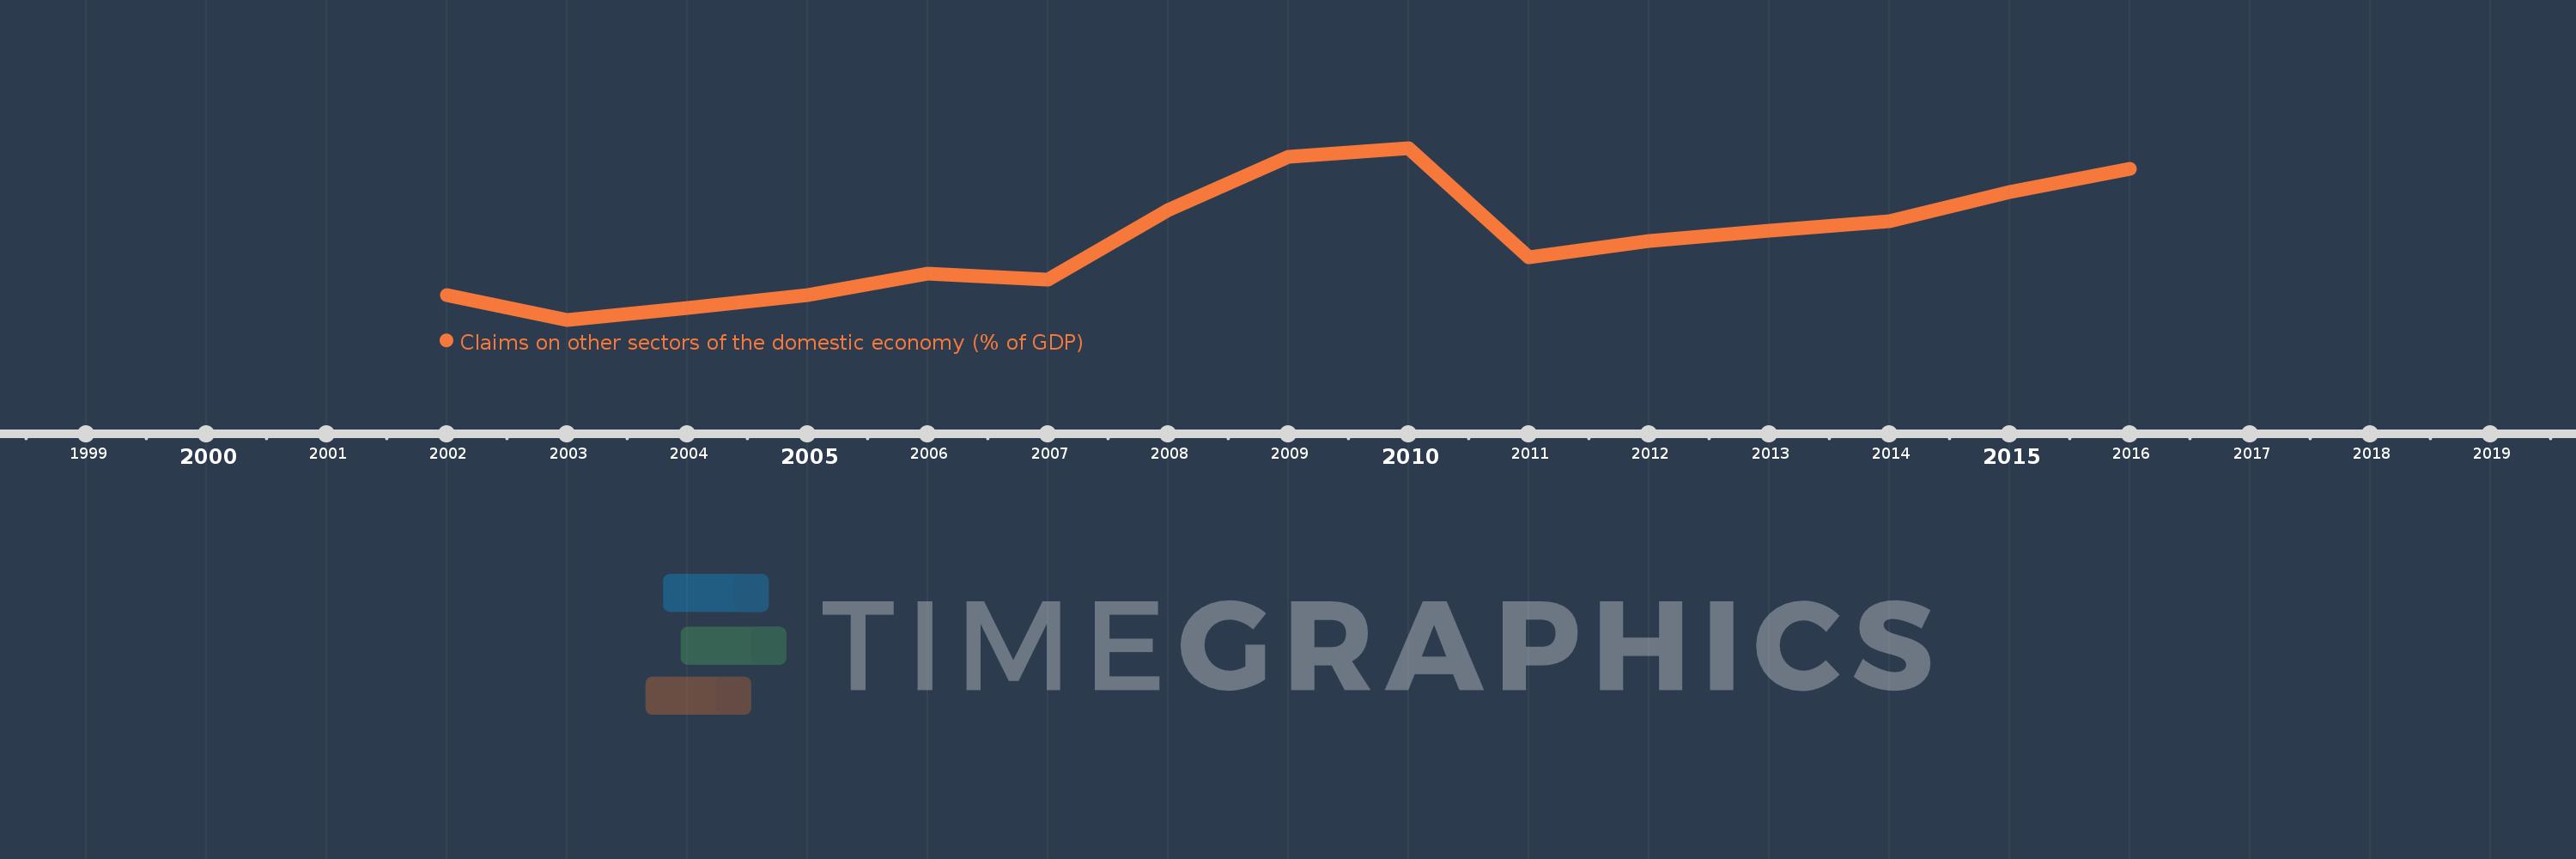
Claims on other sectors of the domestic economy (% of GDP)
2016,2015,2014,2013,2012,2011,2010,2009,2008,2007,2006,2005,2004,2003,2002
This statistics in other country:
Timeline:
This timeline shows a graph from 2002 to 2016 of IDA total. No data until 2001. Number of actual observations by date: 15.
Source name:
World Development Indicators
Source organization:
International Monetary Fund, International Financial Statistics and data files, and World Bank and OECD GDP estimates.
Categories, topics:
Financial Sector
Last updated:
apr 23, 2017
Indicators value changes by year
Minimum:
19.782
jan 1, 2003
Maximum:
28.129
jan 1, 2010
At the date of observation
Value
Absolute change
Change from previous value
jan 1, 2002
20.959
+20.959
0.0%
jan 1, 2003
19.782
-1.178
-5.62%
jan 1, 2004
20.363
+0.582
2.94%
jan 1, 2005
20.985
+0.622
3.05%
jan 1, 2006
22.004
+1.019
4.85%
jan 1, 2007
21.741
-0.263
-1.19%
jan 1, 2008
25.128
+3.387
15.58%
jan 1, 2009
27.719
+2.591
10.31%
jan 1, 2010
28.129
+0.409
1.48%
jan 1, 2011
22.829
-5.299
-18.84%
jan 1, 2012
23.595
+0.766
3.35%
jan 1, 2013
24.126
+0.53
2.25%
jan 1, 2014
24.559
+0.434
1.8%
jan 1, 2015
25.984
+1.424
5.8%
jan 1, 2016
27.122
+1.138
4.38%
Ranking of countries by current statistics by years


Comments: