29
/
en
AIzaSyAYiBZKx7MnpbEhh9jyipgxe19OcubqV5w
April 1, 2024
68642
Antigua and Barbuda
ATG
true
2
1
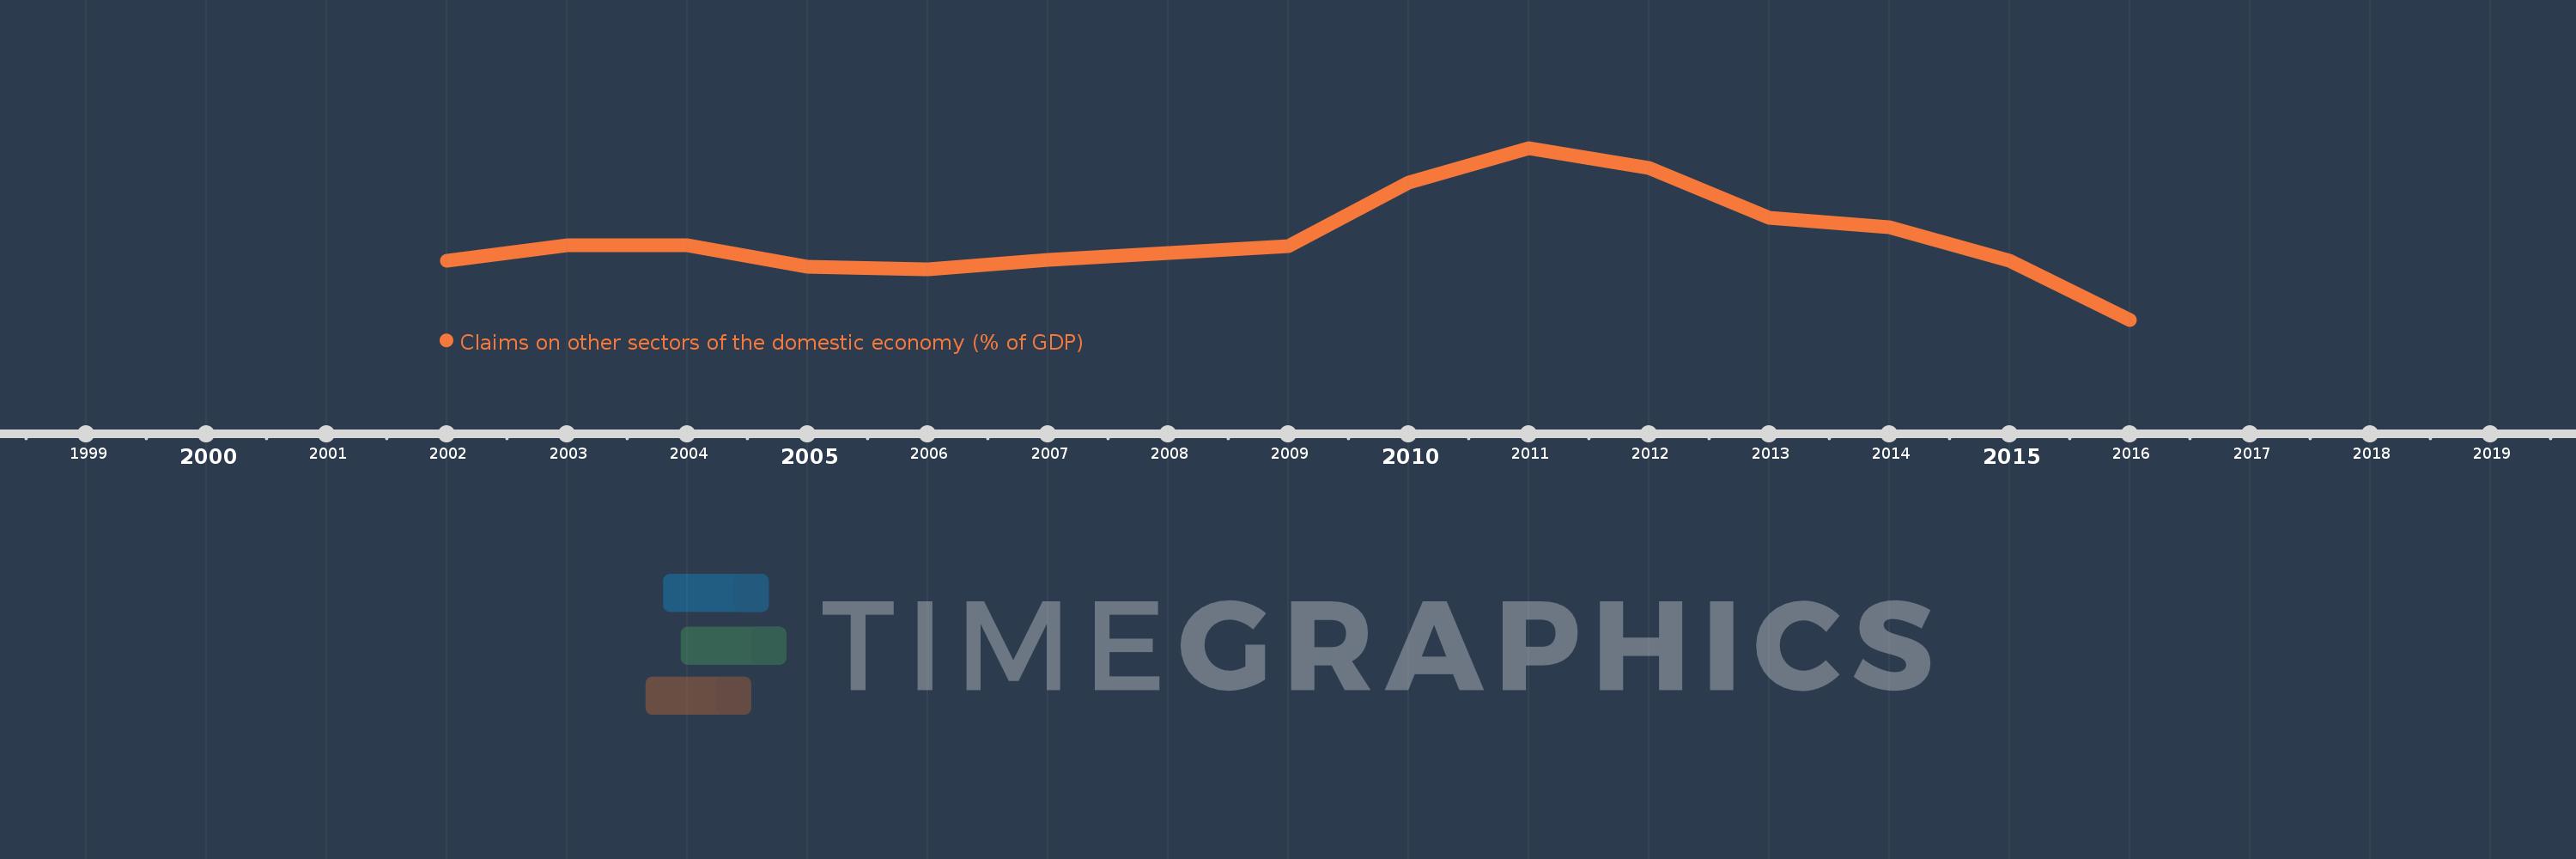
Claims on other sectors of the domestic economy (% of GDP)
2016,2015,2014,2013,2012,2011,2010,2009,2008,2007,2006,2005,2004,2003,2002
This statistics in other country:
Timeline:
This timeline shows a graph from 2002 to 2016 of Antigua and Barbuda. No data until 2001. Number of actual observations by date: 15.
Source name:
World Development Indicators
Source organization:
International Monetary Fund, International Financial Statistics and data files, and World Bank and OECD GDP estimates.
Categories, topics:
Financial Sector
Last updated:
apr 23, 2017
Indicators value changes by year
Maximum:
85.576
jan 1, 2011
At the date of observation
Value
Absolute change
Change from previous value
jan 1, 2002
69.002
+69.002
0.0%
jan 1, 2003
71.166
+2.164
3.14%
jan 1, 2004
71.209
+0.043
0.06%
jan 1, 2005
68.094
-3.114
-4.37%
jan 1, 2006
67.662
-0.433
-0.64%
jan 1, 2007
69.118
+1.456
2.15%
jan 1, 2008
70.107
+0.99
1.43%
jan 1, 2009
71.079
+0.972
1.39%
jan 1, 2010
80.434
+9.355
13.16%
jan 1, 2011
85.576
+5.142
6.39%
jan 1, 2012
82.591
-2.986
-3.49%
jan 1, 2013
75.305
-7.286
-8.82%
jan 1, 2014
73.862
-1.443
-1.92%
jan 1, 2015
68.927
-4.935
-6.68%
jan 1, 2016
60.25
-8.677
-12.59%
Ranking of countries by current statistics by years


Comments: