This statistics in other country:
Timeline:
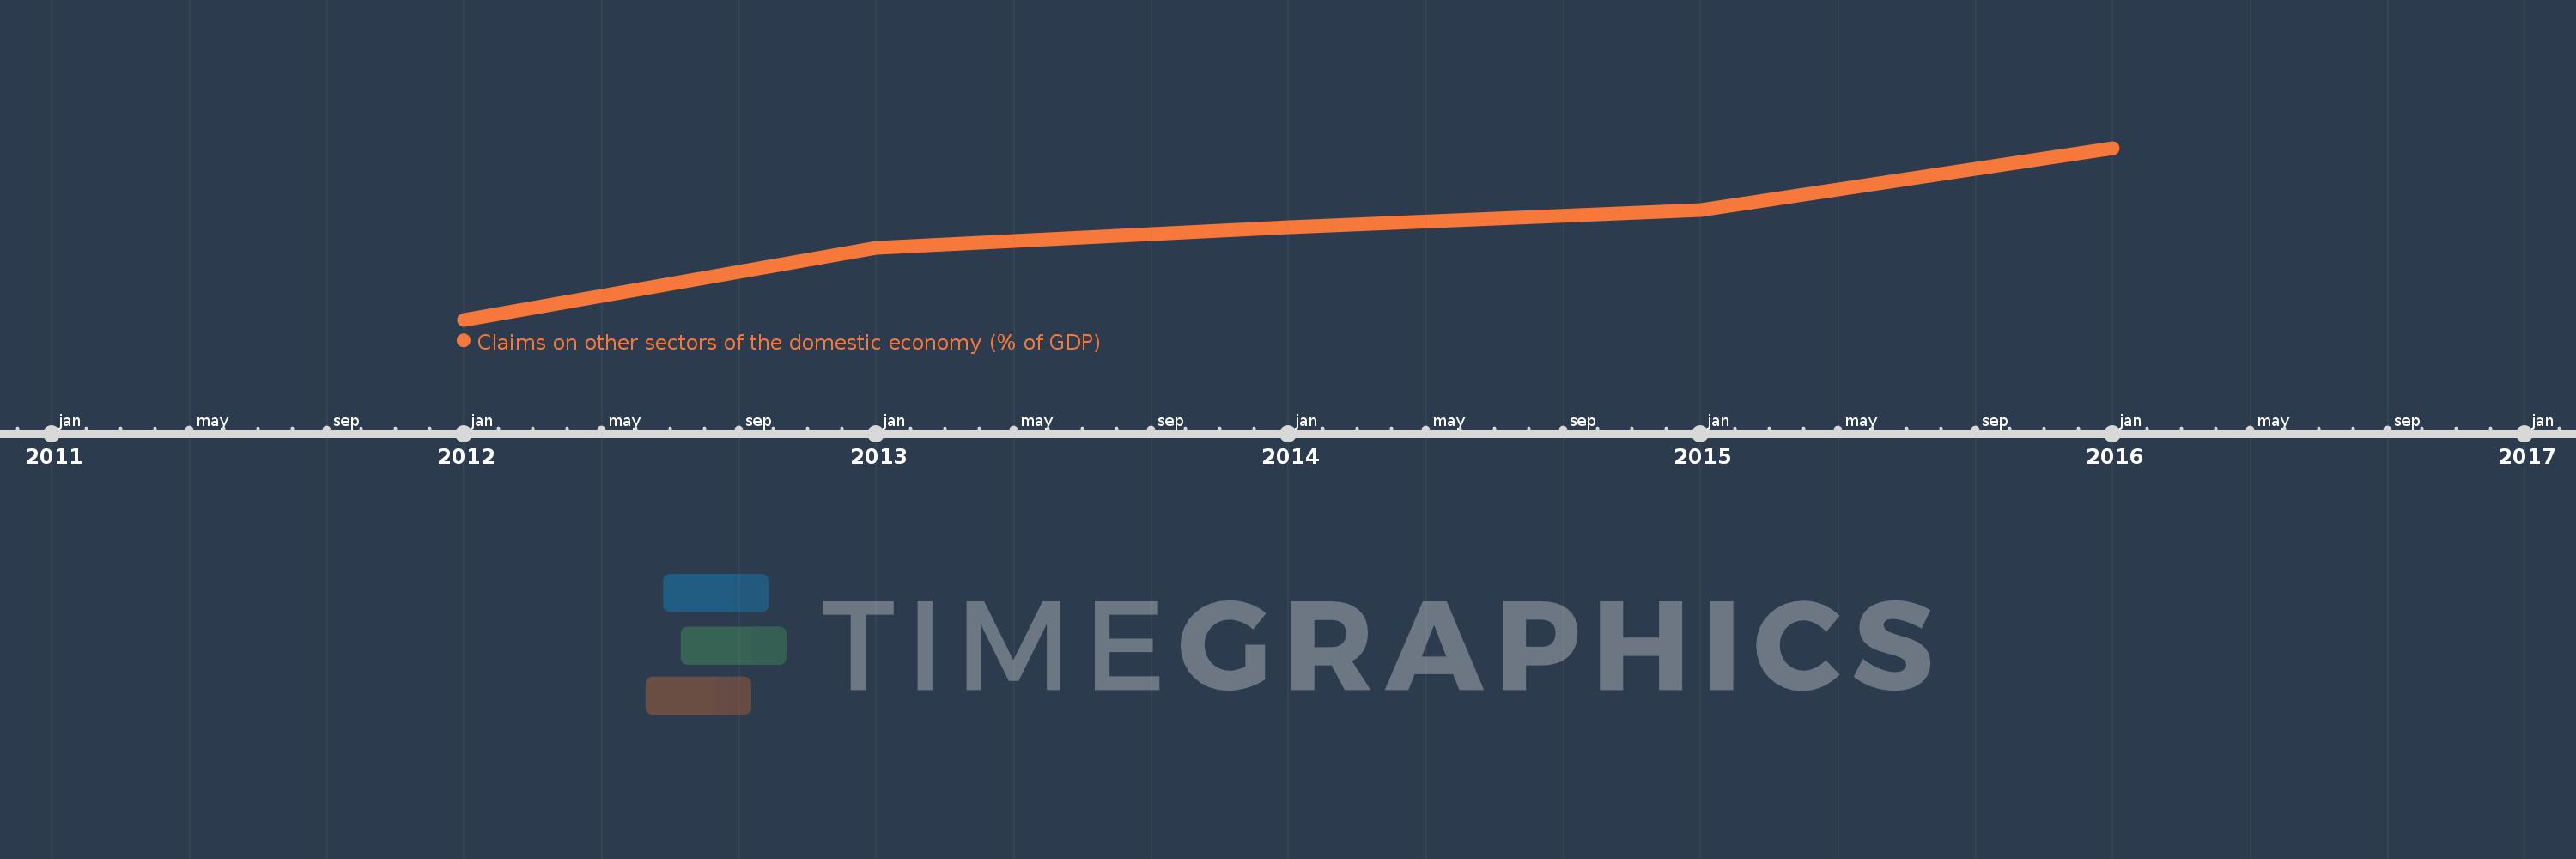
This timeline shows a graph from 2012 to 2016 of South Sudan. No data until 2011. Number of actual observations by date: 5.
Source name:
World Development Indicators
Source organization:
International Monetary Fund, International Financial Statistics and data files, and World Bank and OECD GDP estimates.
Categories, topics:
Financial Sector
Last updated:
apr 23, 2017
Indicators value changes by year
At the date of observation
Value
Absolute change
Change from previous value
jan 1, 2012
0.483
+0.483
0.0%
jan 1, 2013
1.409
+0.926
191.61%
jan 1, 2014
1.678
+0.269
19.07%
jan 1, 2015
1.903
+0.224
13.38%
jan 1, 2016
2.703
+0.8
42.07%
Ranking of countries by current statistics by years


Comments: