29
/
en
AIzaSyAYiBZKx7MnpbEhh9jyipgxe19OcubqV5w
April 1, 2024
34085
Fragile and conflict affected situations
FCS
false
2
1
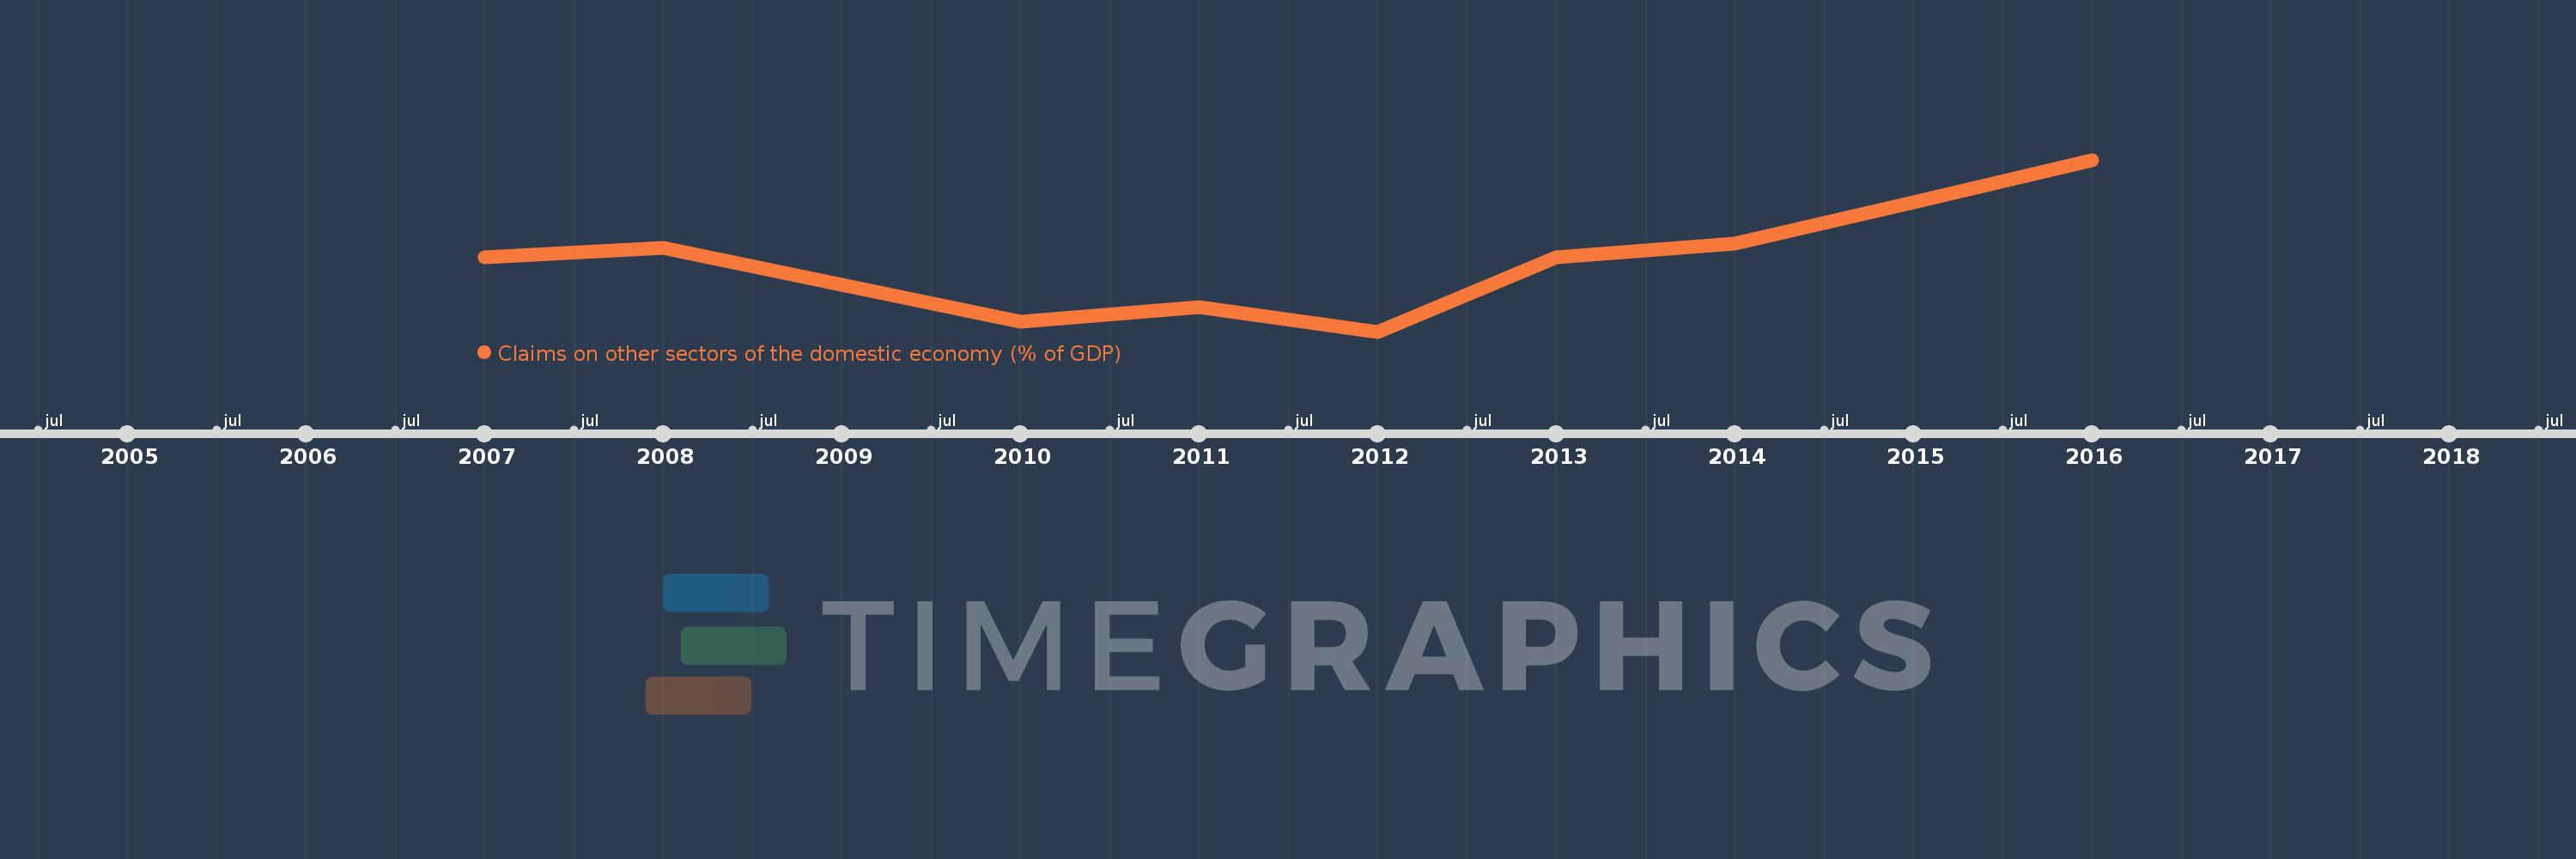
Claims on other sectors of the domestic economy (% of GDP)
2016,2015,2014,2013,2012,2011,2010,2008,2007
This statistics in other country:
Timeline:
This timeline shows a graph from 2007 to 2016 of Fragile and conflict affected situations. No data until 2006. Number of actual observations by date: 9.
Source name:
World Development Indicators
Source organization:
International Monetary Fund, International Financial Statistics and data files, and World Bank and OECD GDP estimates.
Categories, topics:
Financial Sector
Last updated:
apr 23, 2017
Indicators value changes by year
Maximum:
13.864
jan 1, 2016
At the date of observation
Value
Absolute change
Change from previous value
jan 1, 2007
11.309
+11.309
0.0%
jan 1, 2008
11.552
+0.243
2.15%
jan 1, 2010
9.627
-1.925
-16.66%
jan 1, 2011
10.009
+0.382
3.97%
jan 1, 2012
9.372
-0.637
-6.37%
jan 1, 2013
11.319
+1.947
20.78%
jan 1, 2014
11.677
+0.358
3.16%
jan 1, 2015
12.756
+1.079
9.24%
jan 1, 2016
13.864
+1.109
8.69%
Ranking of countries by current statistics by years


Comments: