29
/
en
AIzaSyAYiBZKx7MnpbEhh9jyipgxe19OcubqV5w
April 1, 2024
31373
Europe & Central Asia (excluding high income)
ECA
false
2
1
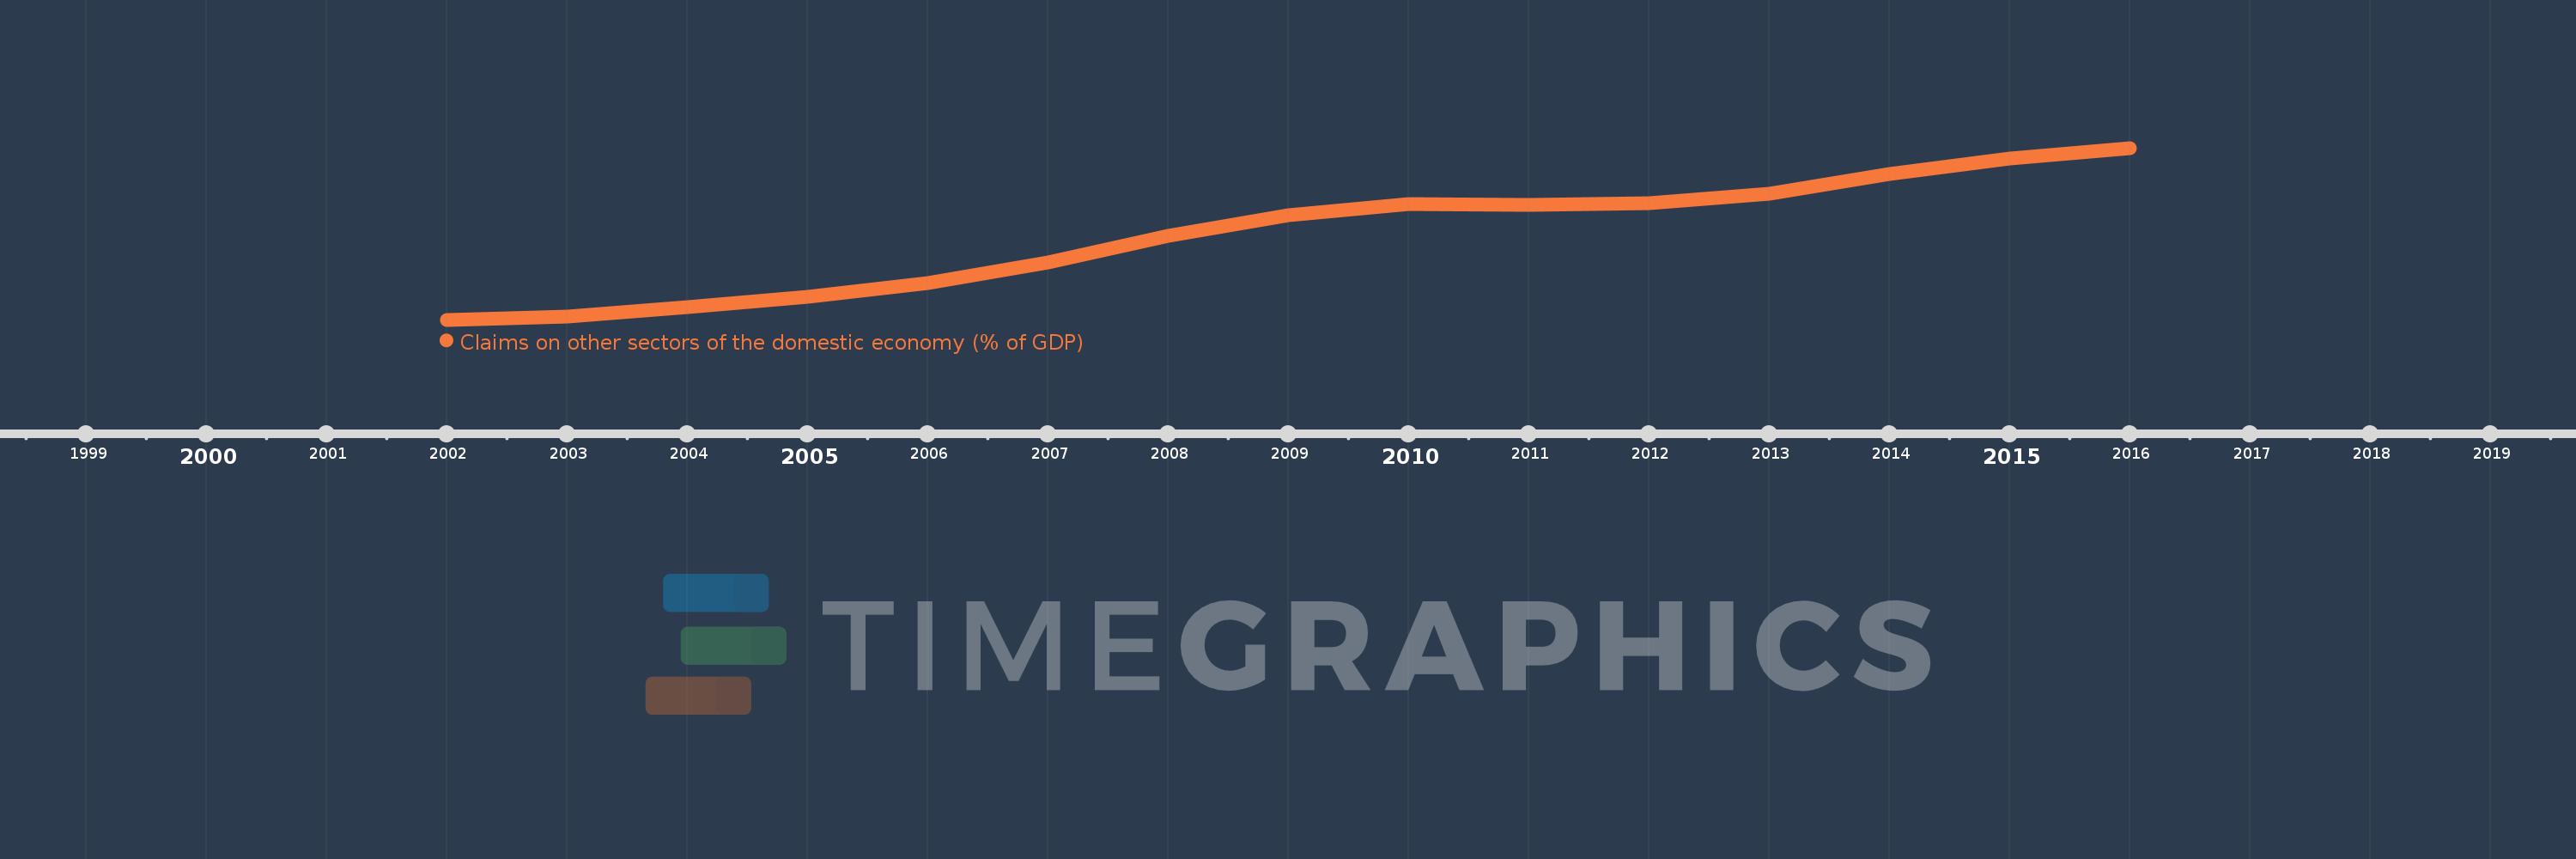
Claims on other sectors of the domestic economy (% of GDP)
2016,2015,2014,2013,2012,2011,2010,2009,2008,2007,2006,2005,2004,2003,2002
This statistics in other country:
Timeline:
This timeline shows a graph from 2002 to 2016 of Europe & Central Asia (excluding high income). No data until 2001. Number of actual observations by date: 15.
Source name:
World Development Indicators
Source organization:
International Monetary Fund, International Financial Statistics and data files, and World Bank and OECD GDP estimates.
Categories, topics:
Financial Sector
Last updated:
apr 23, 2017
Indicators value changes by year
Minimum:
16.568
jan 1, 2002
Maximum:
61.254
jan 1, 2016
At the date of observation
Value
Absolute change
Change from previous value
jan 1, 2002
16.568
+16.568
0.0%
jan 1, 2003
17.417
+0.849
5.12%
jan 1, 2004
19.825
+2.409
13.83%
jan 1, 2005
22.615
+2.789
14.07%
jan 1, 2006
26.089
+3.474
15.36%
jan 1, 2007
31.579
+5.49
21.05%
jan 1, 2008
38.446
+6.866
21.74%
jan 1, 2009
43.778
+5.332
13.87%
jan 1, 2010
46.75
+2.972
6.79%
jan 1, 2011
46.447
-0.303
-0.65%
jan 1, 2012
46.804
+0.357
0.77%
jan 1, 2013
49.444
+2.64
5.64%
jan 1, 2014
54.504
+5.06
10.23%
jan 1, 2015
58.433
+3.928
7.21%
jan 1, 2016
61.254
+2.822
4.83%
Ranking of countries by current statistics by years


Comments: