29
/
en
AIzaSyAYiBZKx7MnpbEhh9jyipgxe19OcubqV5w
April 1, 2024
133903
France
FRA
true
2
1
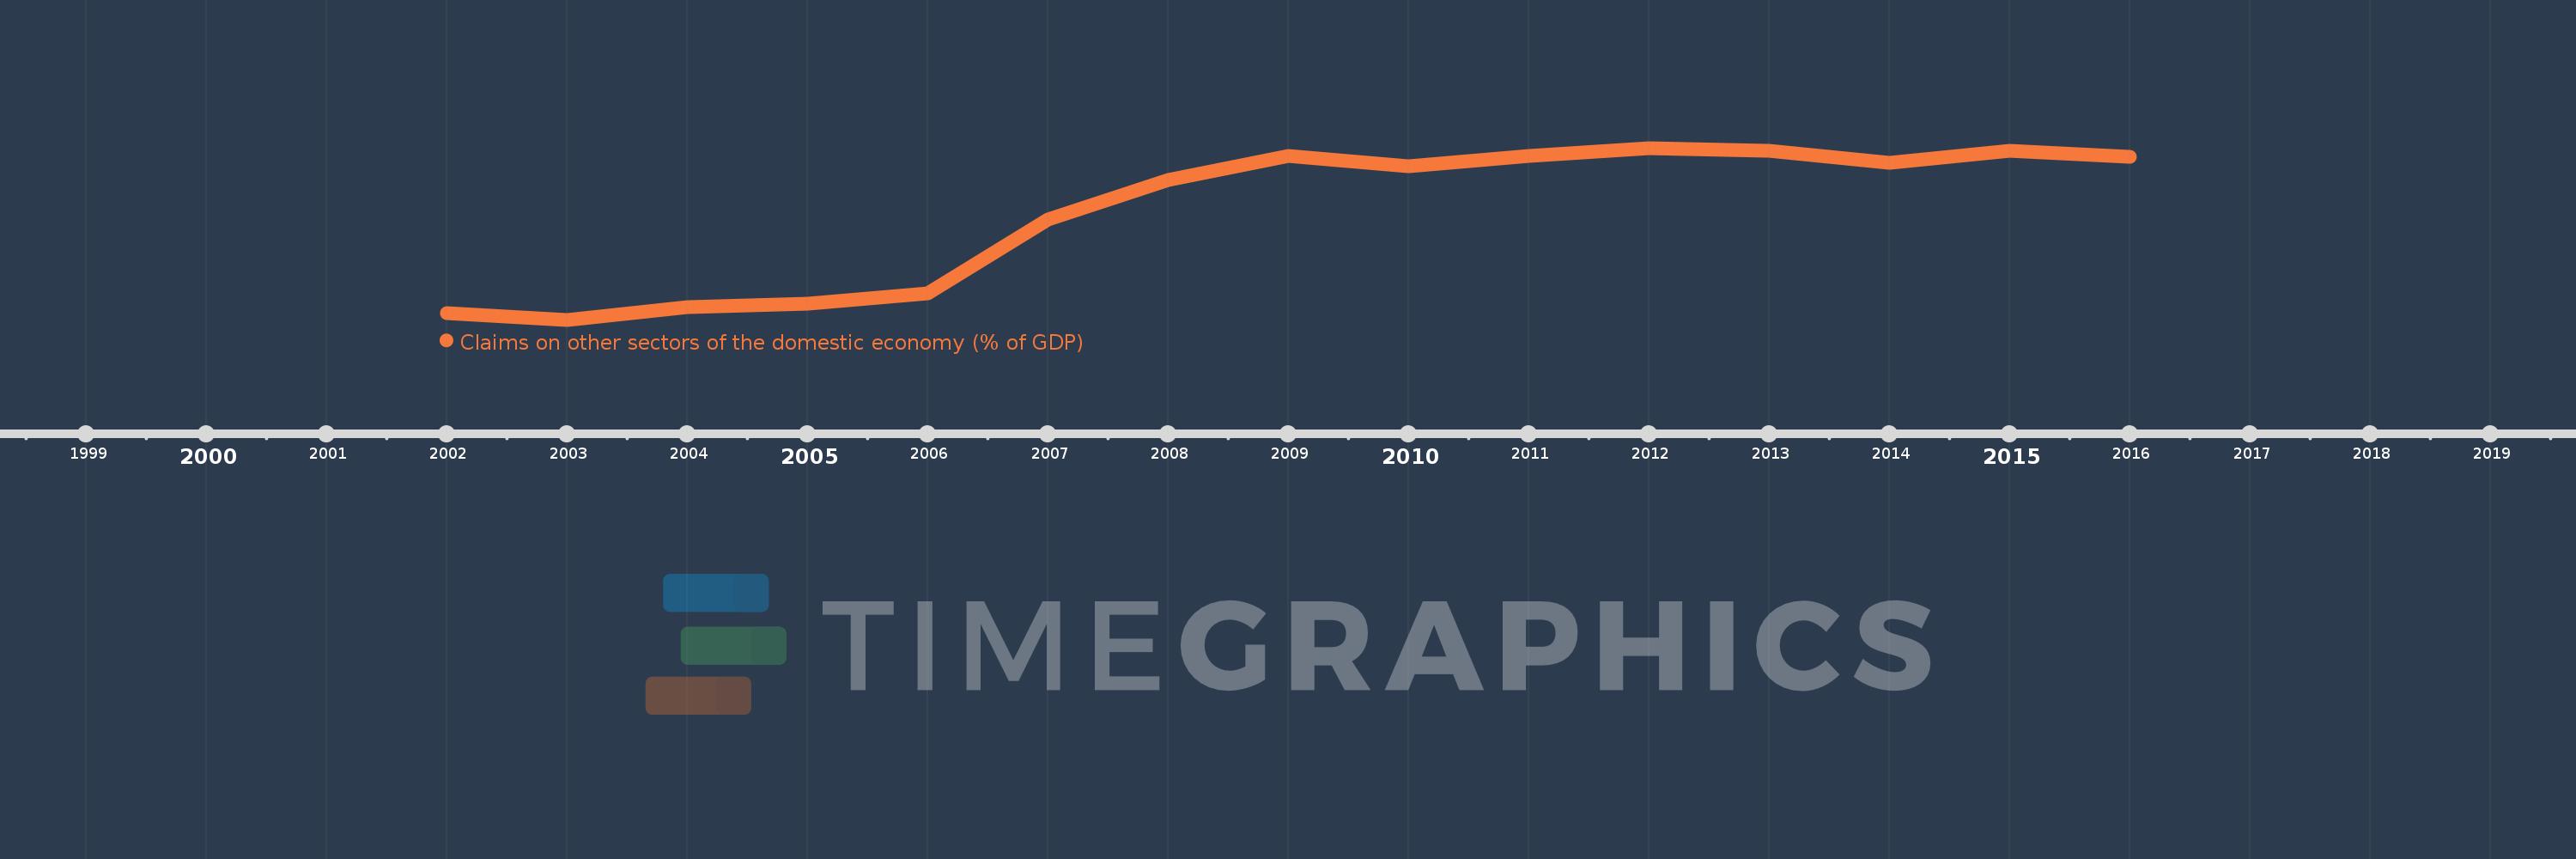
Claims on other sectors of the domestic economy (% of GDP)
2016,2015,2014,2013,2012,2011,2010,2009,2008,2007,2006,2005,2004,2003,2002
This statistics in other country:
Timeline:
This timeline shows a graph from 2002 to 2016 of France. No data until 2001. Number of actual observations by date: 15.
Source name:
World Development Indicators
Source organization:
International Monetary Fund, International Financial Statistics and data files, and World Bank and OECD GDP estimates.
Categories, topics:
Financial Sector
Last updated:
apr 23, 2017
Indicators value changes by year
Minimum:
91.026
jan 1, 2003
Maximum:
138.714
jan 1, 2012
At the date of observation
Value
Absolute change
Change from previous value
jan 1, 2002
92.835
+92.835
0.0%
jan 1, 2003
91.026
-1.81
-1.95%
jan 1, 2004
94.518
+3.492
3.84%
jan 1, 2005
95.557
+1.039
1.1%
jan 1, 2006
98.317
+2.76
2.89%
jan 1, 2007
118.873
+20.556
20.91%
jan 1, 2008
129.93
+11.057
9.3%
jan 1, 2009
136.511
+6.581
5.07%
jan 1, 2010
133.651
-2.86
-2.09%
jan 1, 2011
136.405
+2.754
2.06%
jan 1, 2012
138.714
+2.308
1.69%
jan 1, 2013
137.982
-0.732
-0.53%
jan 1, 2014
134.579
-3.403
-2.47%
jan 1, 2015
137.837
+3.259
2.42%
jan 1, 2016
136.161
-1.677
-1.22%
Ranking of countries by current statistics by years


Comments: