29
/
en
AIzaSyAYiBZKx7MnpbEhh9jyipgxe19OcubqV5w
April 1, 2024
180879
Lithuania
LTU
true
2
1
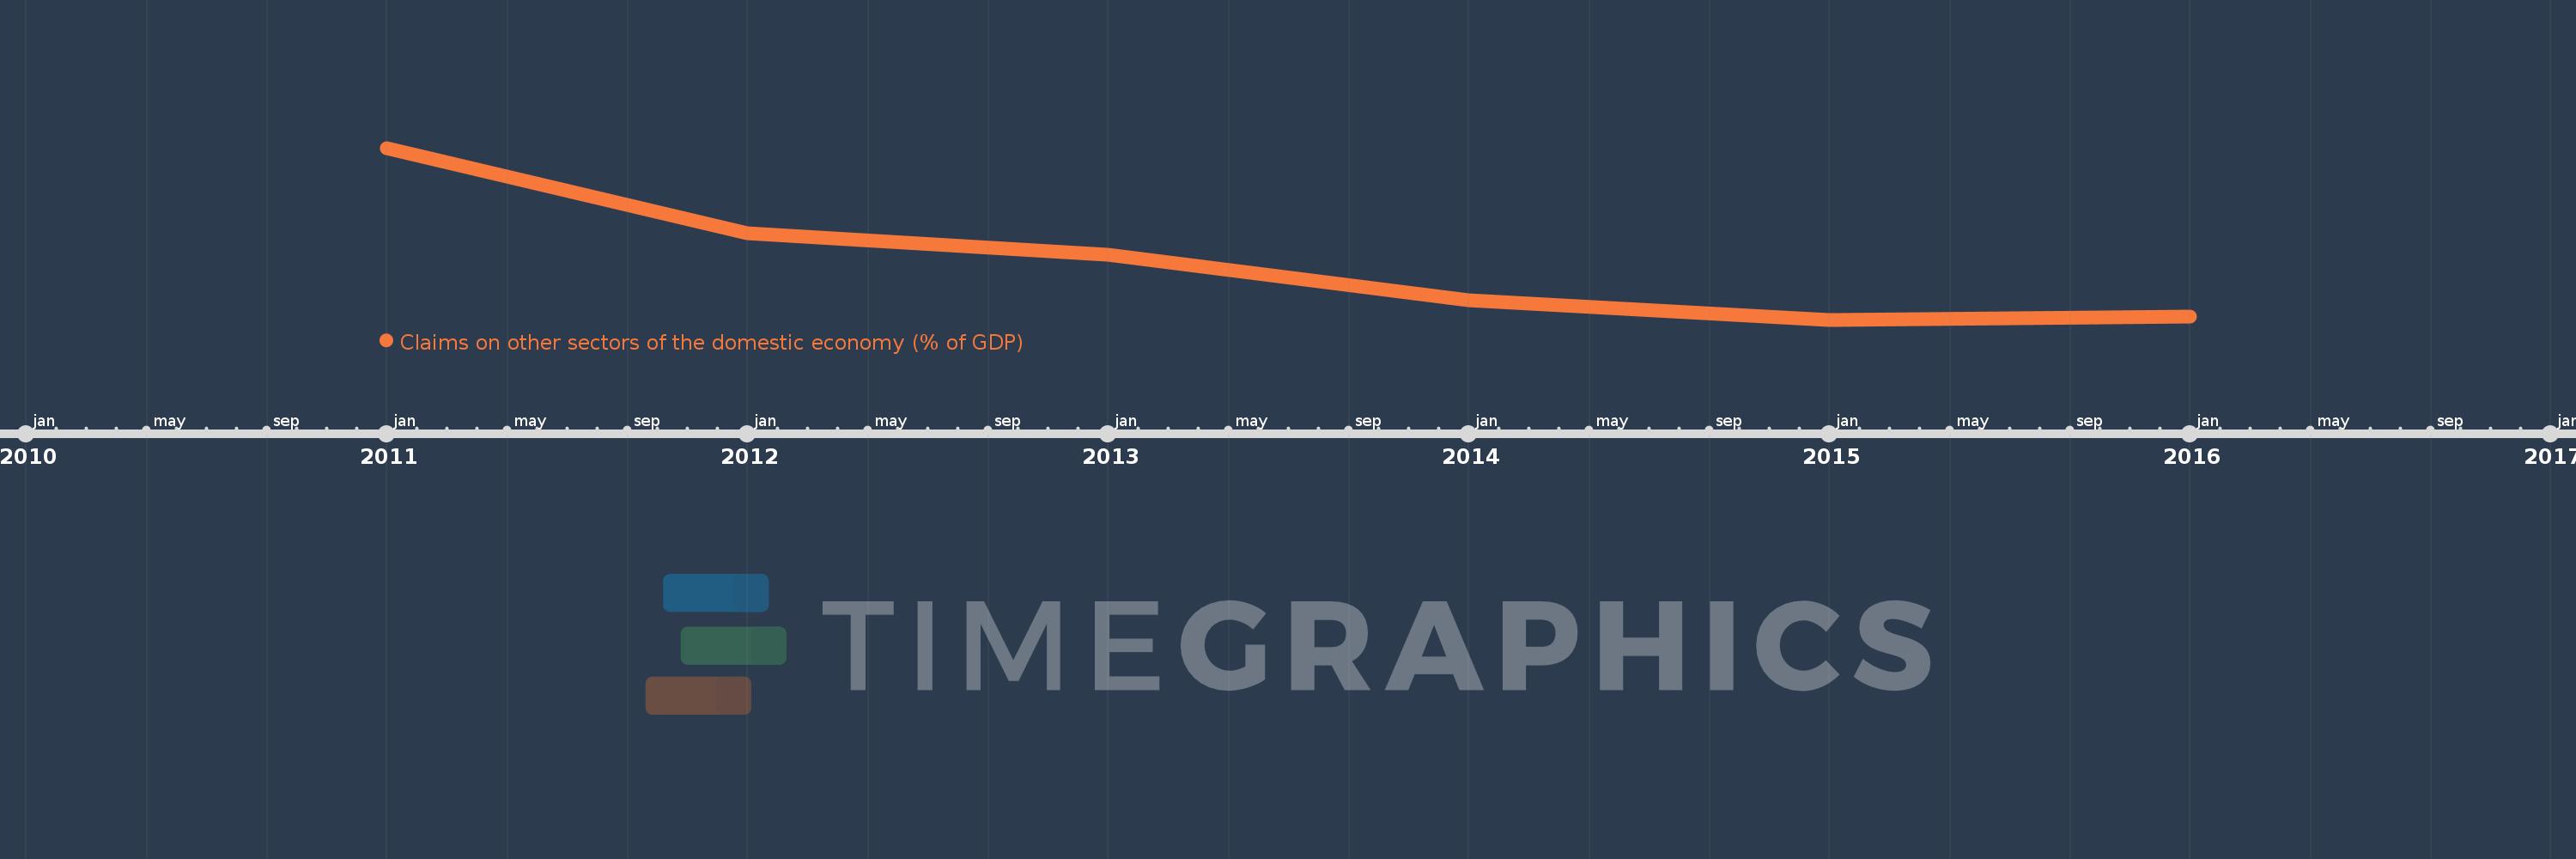
Claims on other sectors of the domestic economy (% of GDP)
2016,2015,2014,2013,2012,2011
This statistics in other country:
Timeline:
This timeline shows a graph from 2011 to 2016 of Lithuania. No data until 2010. Number of actual observations by date: 6.
Source name:
World Development Indicators
Source organization:
International Monetary Fund, International Financial Statistics and data files, and World Bank and OECD GDP estimates.
Categories, topics:
Financial Sector
Last updated:
apr 23, 2017
Indicators value changes by year
Minimum:
46.605
jan 1, 2015
At the date of observation
Value
Absolute change
Change from previous value
jan 1, 2011
65.55
+65.55
0.0%
jan 1, 2012
56.133
-9.416
-14.37%
jan 1, 2013
53.743
-2.391
-4.26%
jan 1, 2014
48.778
-4.964
-9.24%
jan 1, 2015
46.605
-2.173
-4.45%
jan 1, 2016
46.946
+0.341
0.73%
Ranking of countries by current statistics by years


Comments: