29
/
en
AIzaSyAYiBZKx7MnpbEhh9jyipgxe19OcubqV5w
April 1, 2024
147714
Guyana
GUY
true
2
1
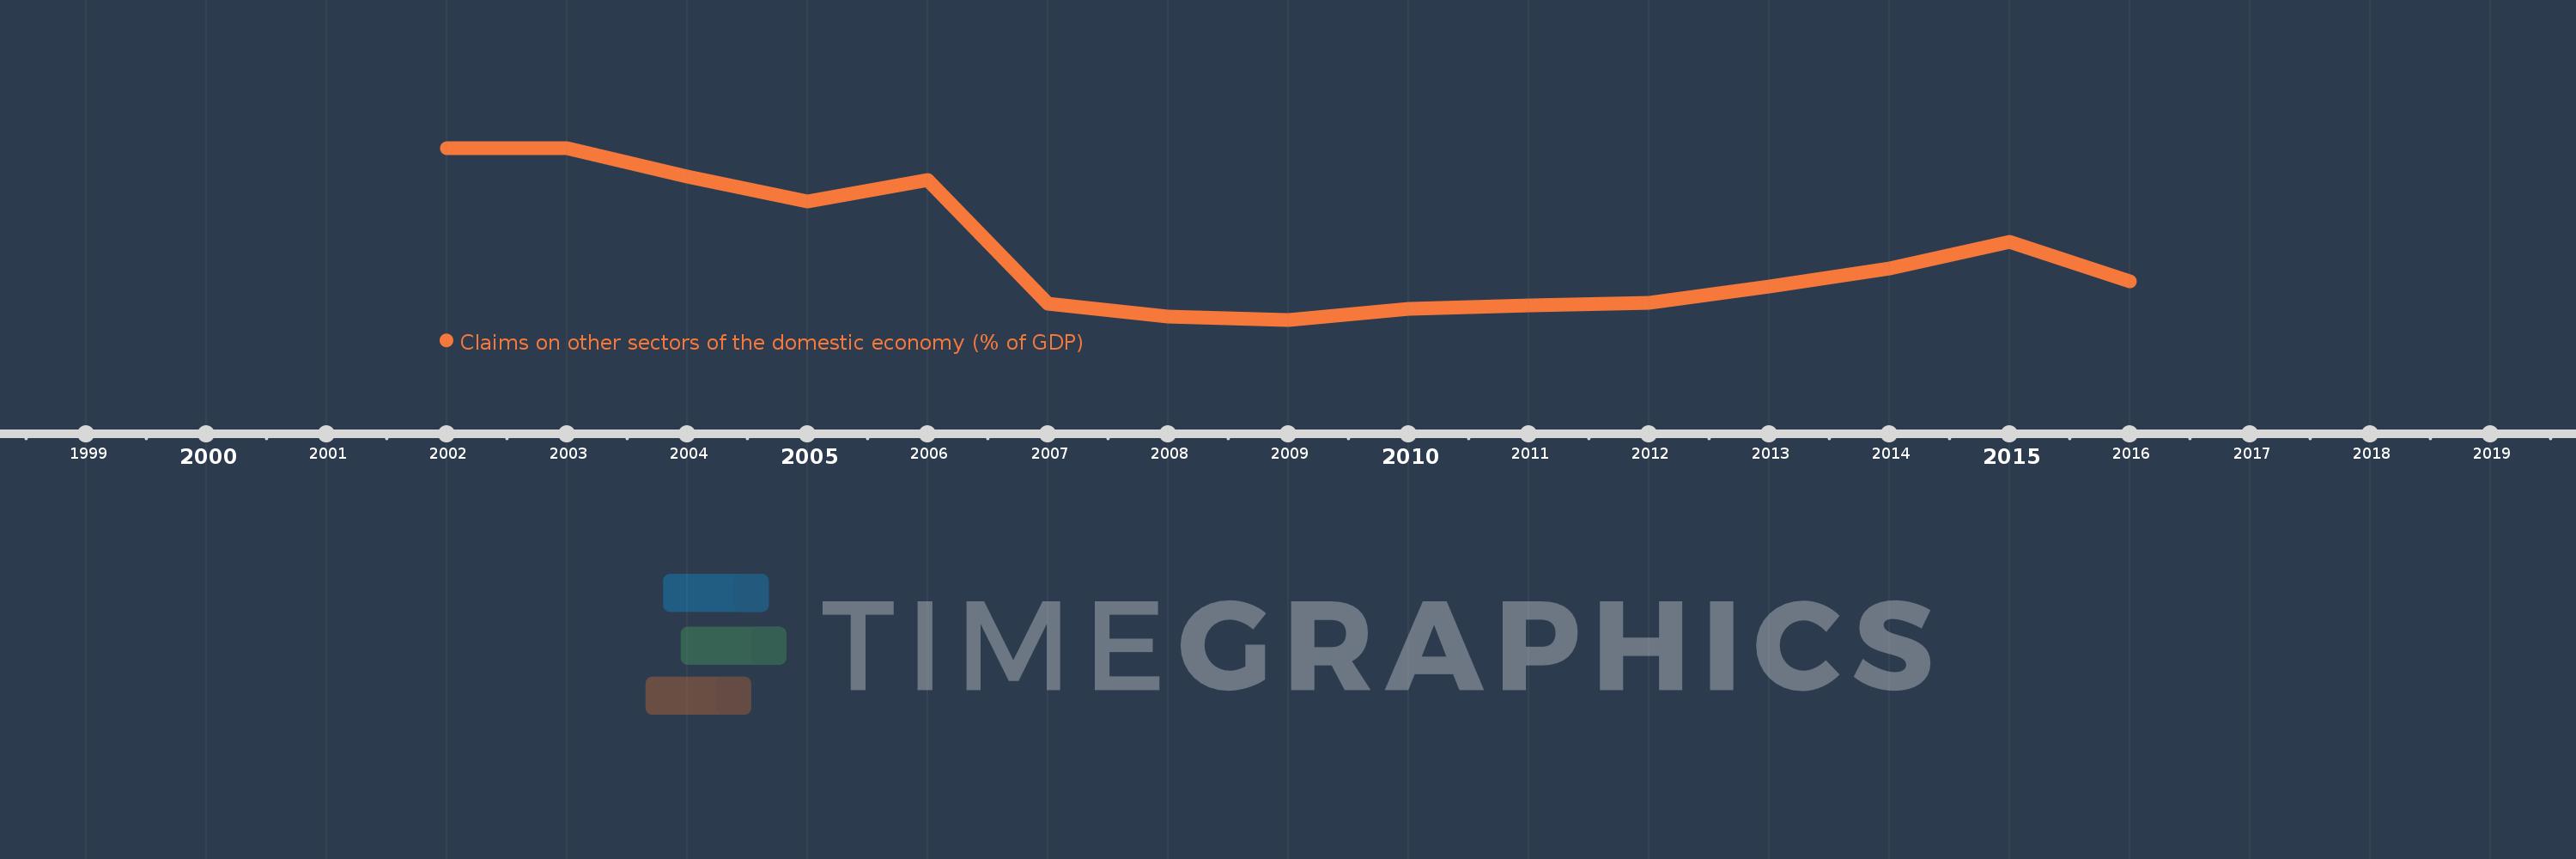
Claims on other sectors of the domestic economy (% of GDP)
2016,2015,2014,2013,2012,2011,2010,2009,2008,2007,2006,2005,2004,2003,2002
This statistics in other country:
Timeline:
This timeline shows a graph from 2002 to 2016 of Guyana. No data until 2001. Number of actual observations by date: 15.
Source name:
World Development Indicators
Source organization:
International Monetary Fund, International Financial Statistics and data files, and World Bank and OECD GDP estimates.
Categories, topics:
Financial Sector
Last updated:
apr 23, 2017
Indicators value changes by year
Maximum:
66.445
jan 1, 2003
At the date of observation
Value
Absolute change
Change from previous value
jan 1, 2002
66.372
+66.372
0.0%
jan 1, 2003
66.445
+0.074
0.11%
jan 1, 2004
61.525
-4.921
-7.41%
jan 1, 2005
57.196
-4.329
-7.04%
jan 1, 2006
60.93
+3.734
6.53%
jan 1, 2007
39.377
-21.553
-35.37%
jan 1, 2008
37.175
-2.202
-5.59%
jan 1, 2009
36.59
-0.585
-1.57%
jan 1, 2010
38.478
+1.888
5.16%
jan 1, 2011
39.042
+0.564
1.47%
jan 1, 2012
39.538
+0.496
1.27%
jan 1, 2013
42.309
+2.772
7.01%
jan 1, 2014
45.57
+3.261
7.71%
jan 1, 2015
50.121
+4.551
9.99%
jan 1, 2016
43.227
-6.894
-13.76%
Ranking of countries by current statistics by years


Comments: