29
/
en
AIzaSyAYiBZKx7MnpbEhh9jyipgxe19OcubqV5w
April 1, 2024
279563
Vanuatu
VUT
true
2
1
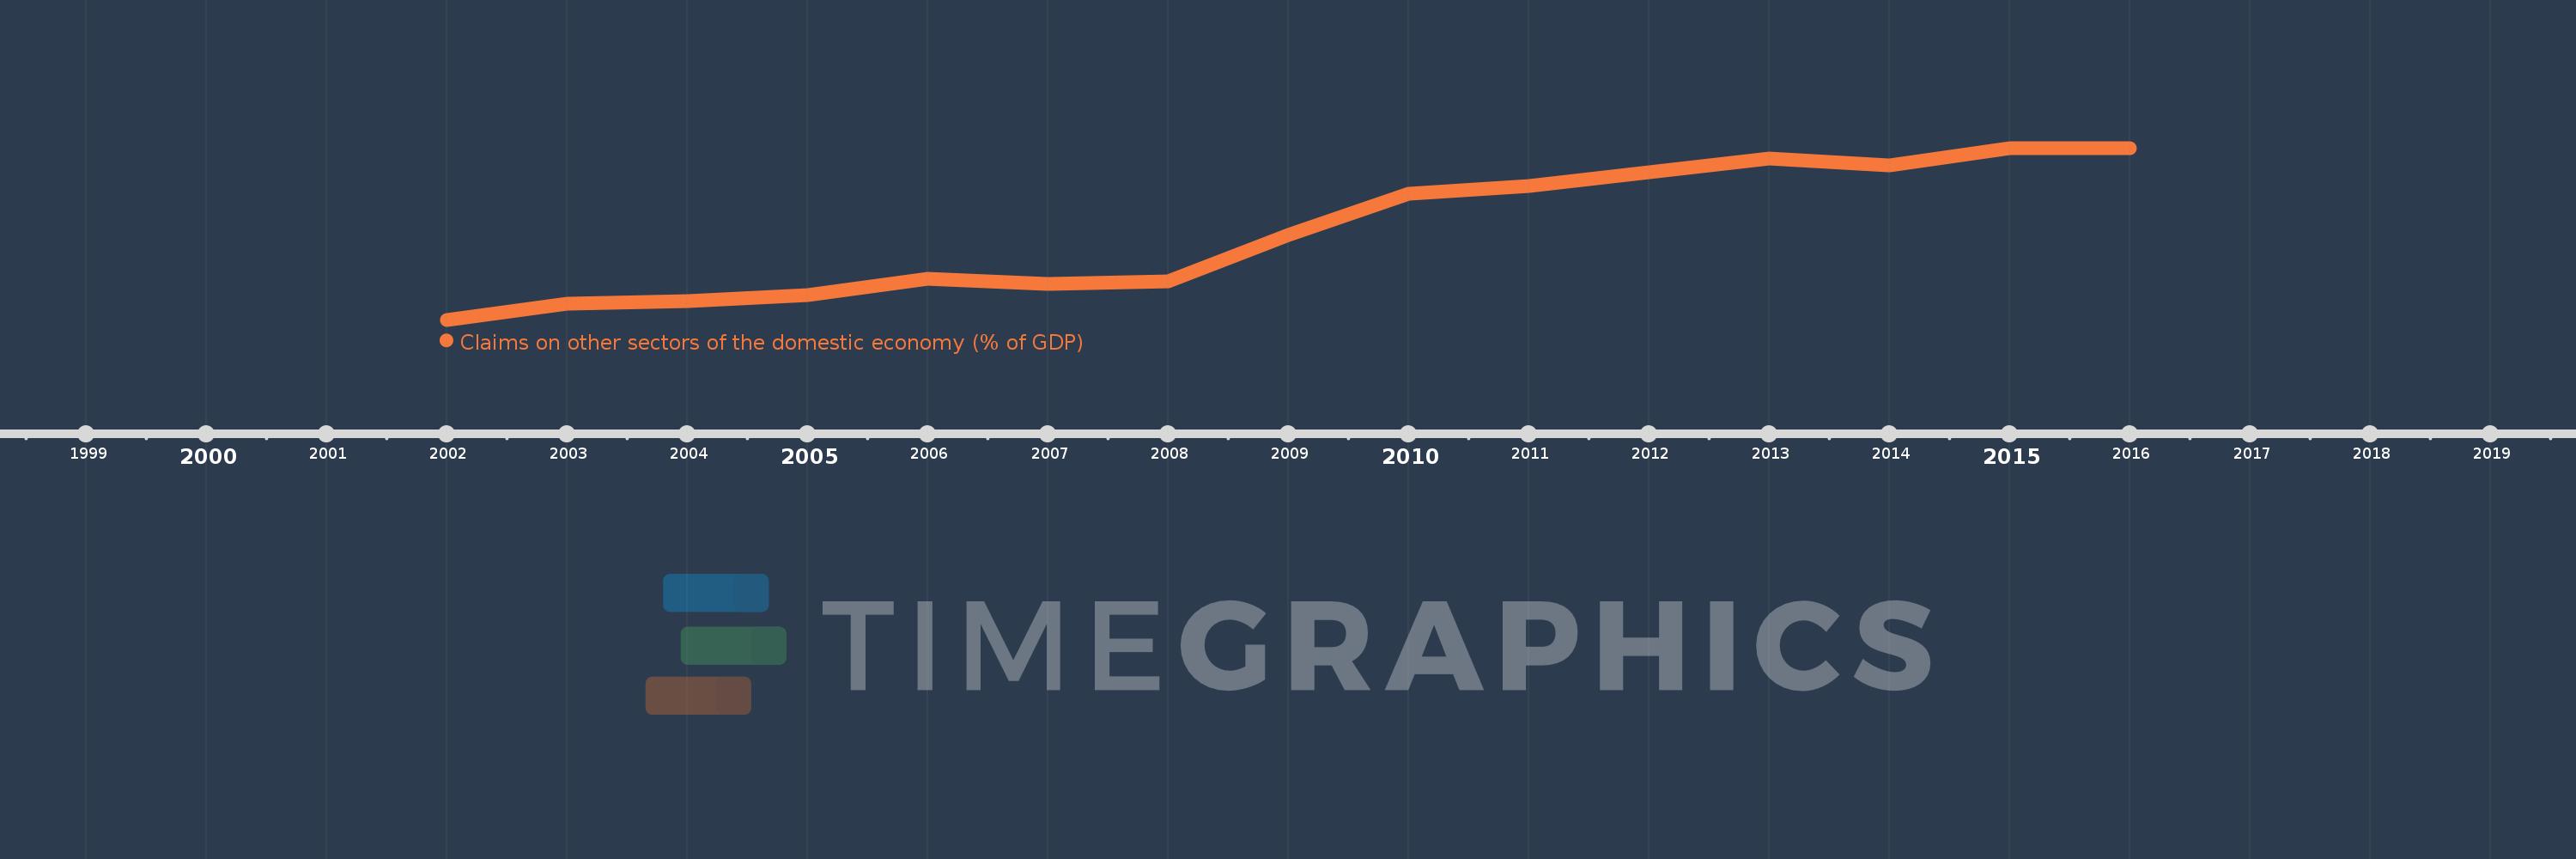
Claims on other sectors of the domestic economy (% of GDP)
2016,2015,2014,2013,2012,2011,2010,2009,2008,2007,2006,2005,2004,2003,2002
This statistics in other country:
Timeline:
This timeline shows a graph from 2002 to 2016 of Vanuatu. No data until 2001. Number of actual observations by date: 15.
Source name:
World Development Indicators
Source organization:
International Monetary Fund, International Financial Statistics and data files, and World Bank and OECD GDP estimates.
Categories, topics:
Financial Sector
Last updated:
apr 23, 2017
Indicators value changes by year
Minimum:
34.379
jan 1, 2002
Maximum:
73.564
jan 1, 2015
At the date of observation
Value
Absolute change
Change from previous value
jan 1, 2002
34.379
+34.379
0.0%
jan 1, 2003
38.094
+3.715
10.81%
jan 1, 2004
38.694
+0.599
1.57%
jan 1, 2005
39.92
+1.227
3.17%
jan 1, 2006
43.697
+3.776
9.46%
jan 1, 2007
42.634
-1.063
-2.43%
jan 1, 2008
43.116
+0.482
1.13%
jan 1, 2009
53.634
+10.518
24.4%
jan 1, 2010
63.168
+9.534
17.78%
jan 1, 2011
64.849
+1.681
2.66%
jan 1, 2012
68.055
+3.206
4.94%
jan 1, 2013
71.078
+3.024
4.44%
jan 1, 2014
69.649
-1.429
-2.01%
jan 1, 2015
73.564
+3.915
5.62%
jan 1, 2016
73.469
-0.095
-0.13%
Ranking of countries by current statistics by years


Comments: