29
/
en
AIzaSyAYiBZKx7MnpbEhh9jyipgxe19OcubqV5w
April 1, 2024
187535
Malaysia
MYS
true
2
1
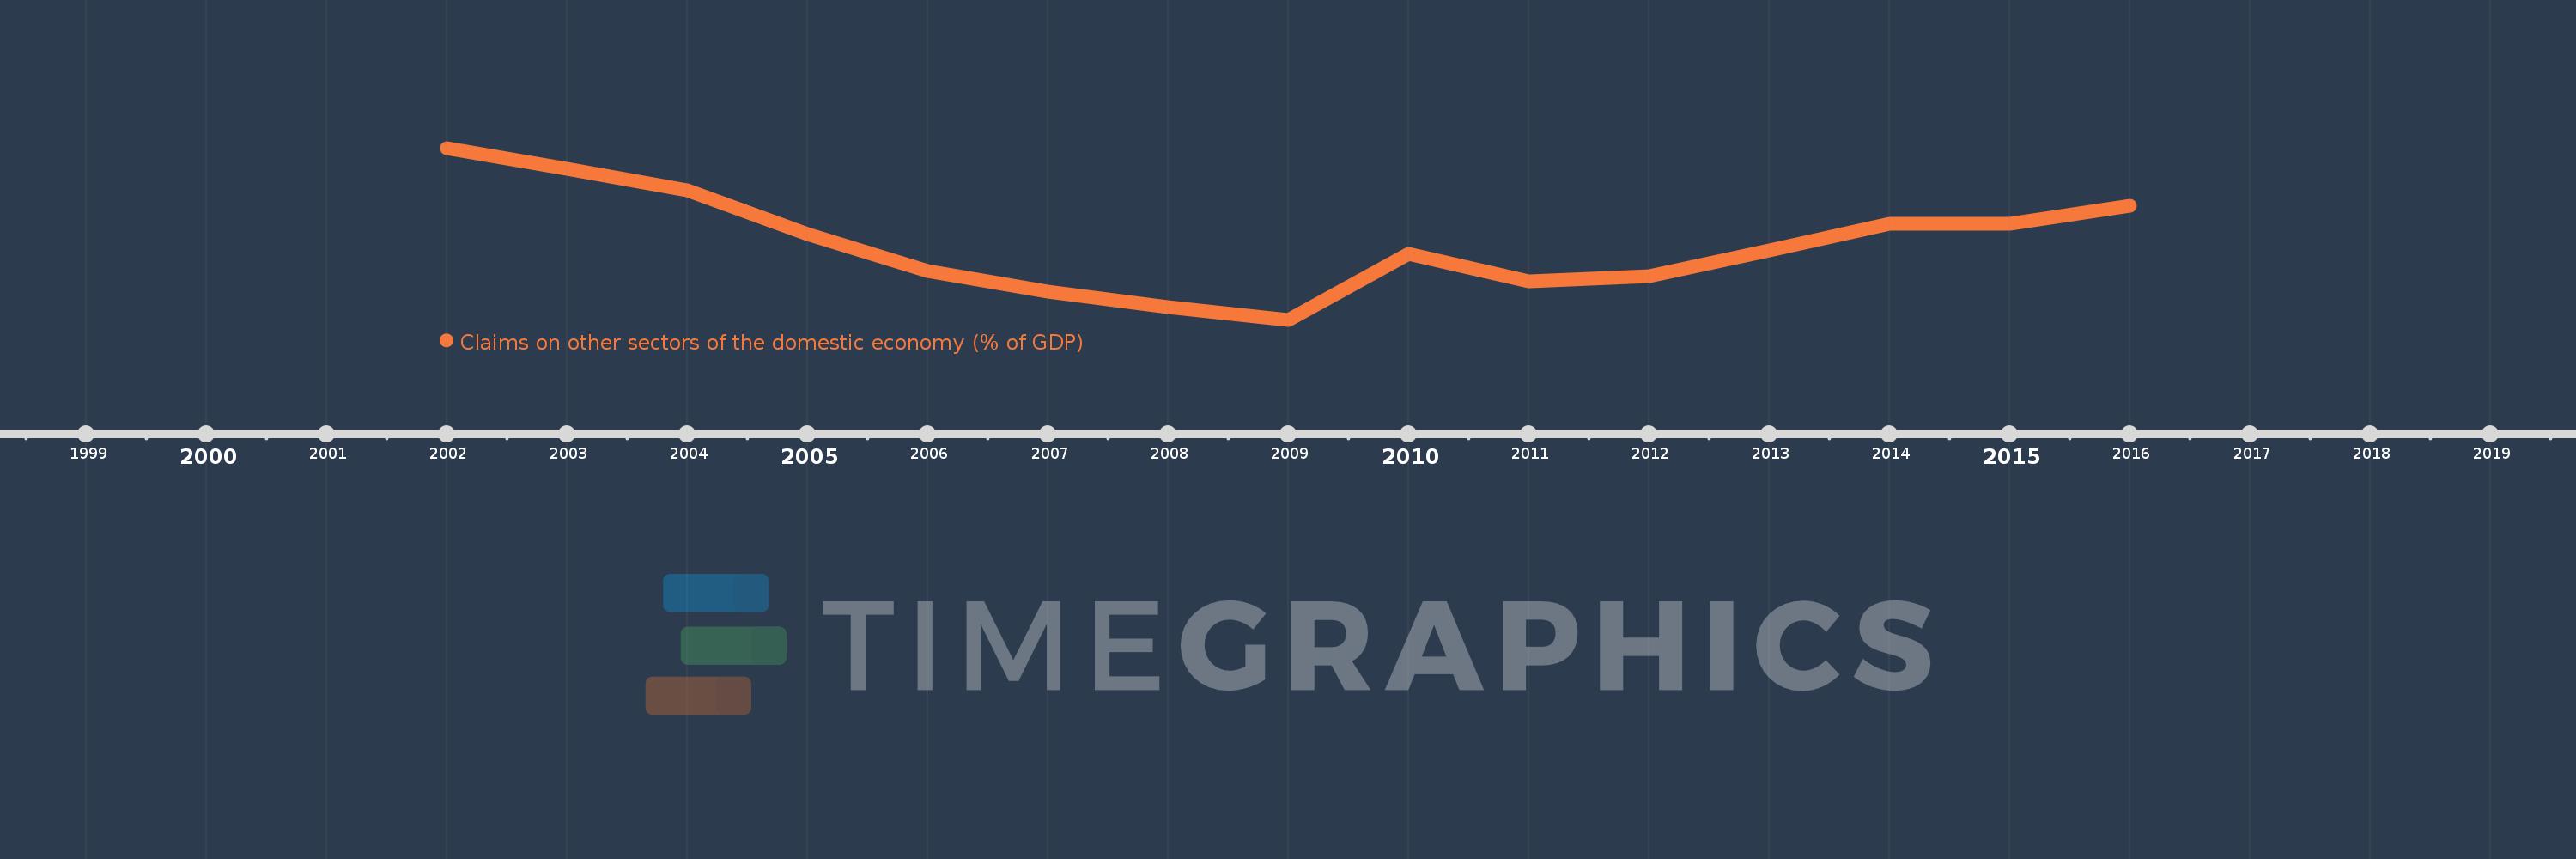
Claims on other sectors of the domestic economy (% of GDP)
2016,2015,2014,2013,2012,2011,2010,2009,2008,2007,2006,2005,2004,2003,2002
This statistics in other country:
Timeline:
This timeline shows a graph from 2002 to 2016 of Malaysia. No data until 2001. Number of actual observations by date: 15.
Source name:
World Development Indicators
Source organization:
International Monetary Fund, International Financial Statistics and data files, and World Bank and OECD GDP estimates.
Categories, topics:
Financial Sector
Last updated:
apr 23, 2017
Indicators value changes by year
Minimum:
108.351
jan 1, 2009
Maximum:
149.489
jan 1, 2002
At the date of observation
Value
Absolute change
Change from previous value
jan 1, 2002
149.489
+149.489
0.0%
jan 1, 2003
144.488
-5.001
-3.35%
jan 1, 2004
139.366
-5.122
-3.54%
jan 1, 2005
128.944
-10.422
-7.48%
jan 1, 2006
119.972
-8.972
-6.96%
jan 1, 2007
115.052
-4.92
-4.1%
jan 1, 2008
111.353
-3.699
-3.22%
jan 1, 2009
108.351
-3.003
-2.7%
jan 1, 2010
124.123
+15.772
14.56%
jan 1, 2011
117.543
-6.579
-5.3%
jan 1, 2012
118.792
+1.249
1.06%
jan 1, 2013
124.855
+6.063
5.1%
jan 1, 2014
131.26
+6.405
5.13%
jan 1, 2015
131.383
+0.123
0.09%
jan 1, 2016
135.726
+4.343
3.31%
Ranking of countries by current statistics by years


Comments: