29
/
en
AIzaSyAYiBZKx7MnpbEhh9jyipgxe19OcubqV5w
April 1, 2024
89560
Botswana
BWA
true
2
1
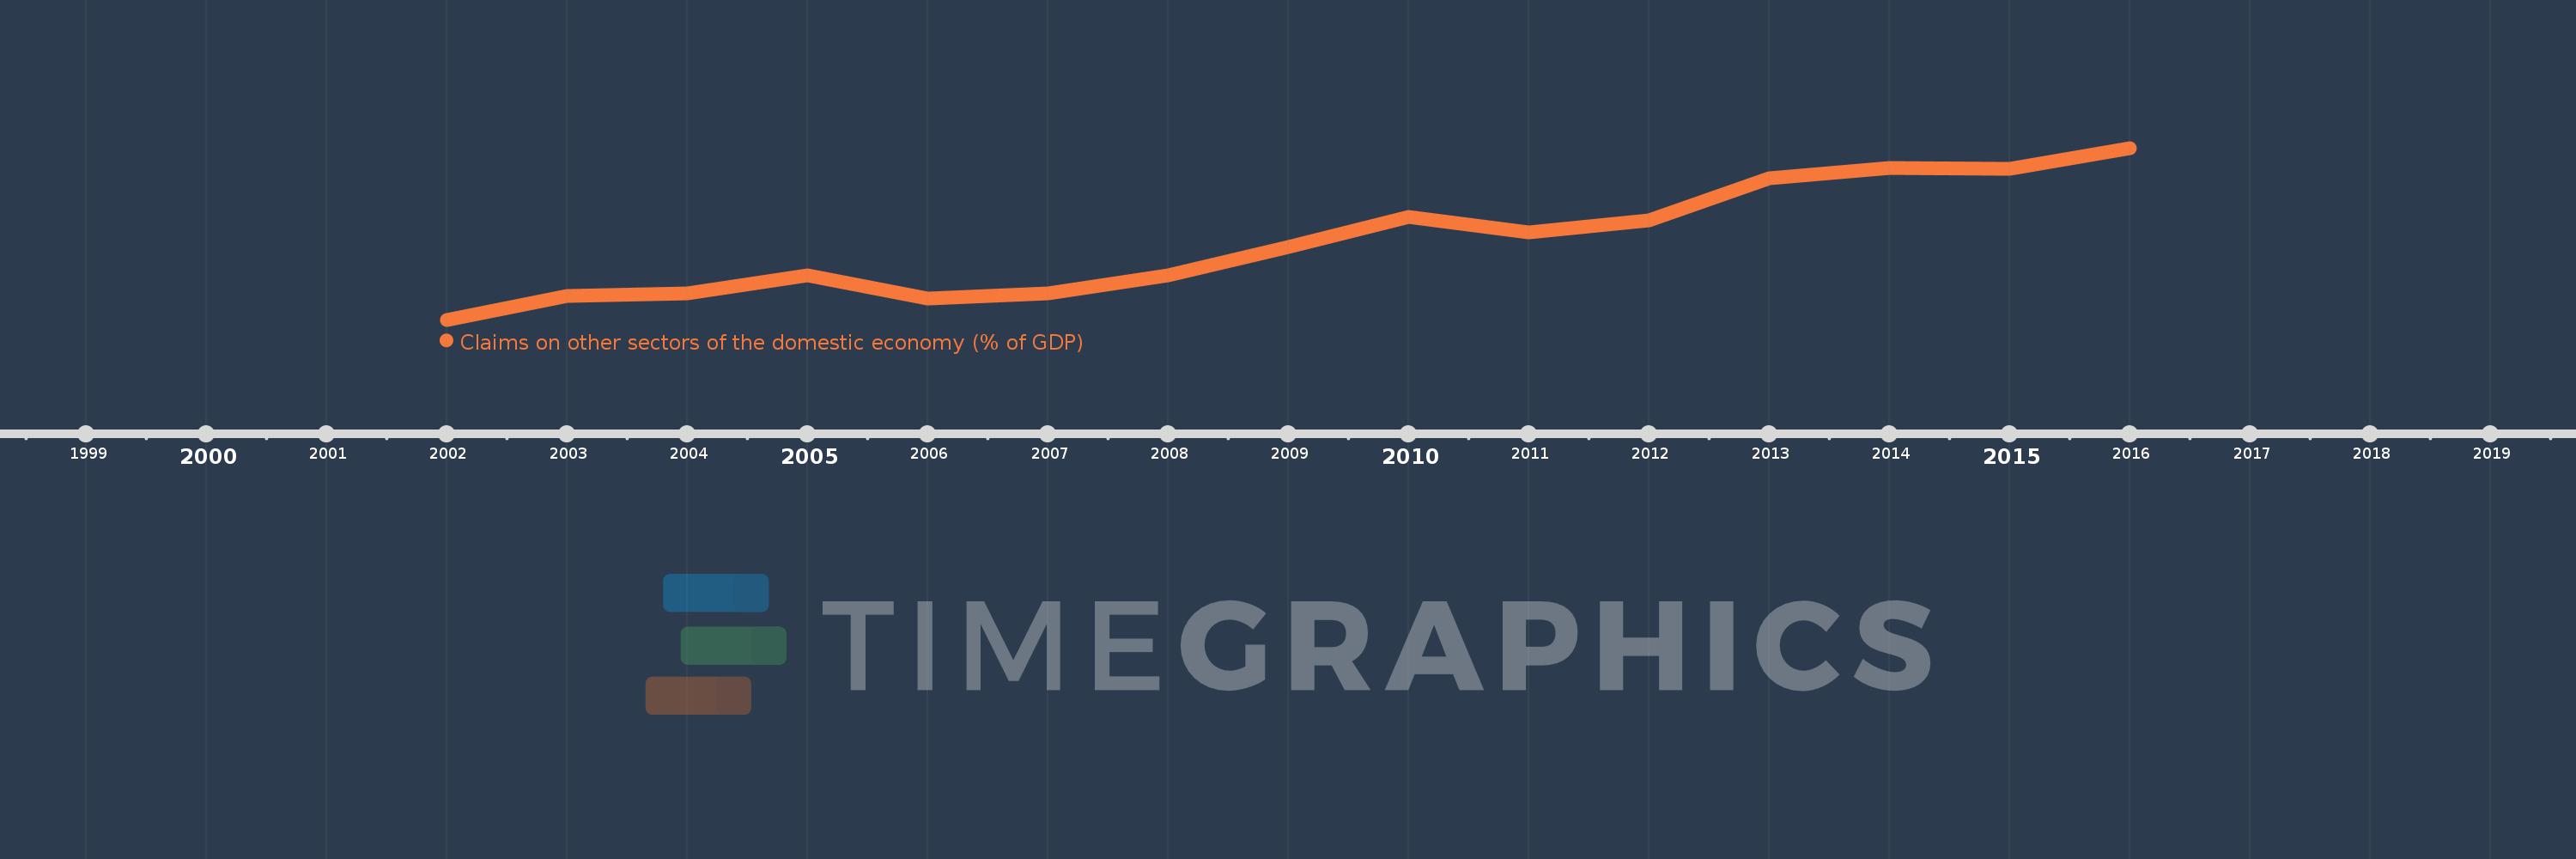
Claims on other sectors of the domestic economy (% of GDP)
2016,2015,2014,2013,2012,2011,2010,2009,2008,2007,2006,2005,2004,2003,2002
This statistics in other country:
Timeline:
This timeline shows a graph from 2002 to 2016 of Botswana. No data until 2001. Number of actual observations by date: 15.
Source name:
World Development Indicators
Source organization:
International Monetary Fund, International Financial Statistics and data files, and World Bank and OECD GDP estimates.
Categories, topics:
Financial Sector
Last updated:
apr 23, 2017
Indicators value changes by year
Minimum:
18.153
jan 1, 2002
Maximum:
36.843
jan 1, 2016
At the date of observation
Value
Absolute change
Change from previous value
jan 1, 2002
18.153
+18.153
0.0%
jan 1, 2003
20.708
+2.555
14.07%
jan 1, 2004
21.039
+0.33
1.6%
jan 1, 2005
22.985
+1.947
9.25%
jan 1, 2006
20.46
-2.525
-10.99%
jan 1, 2007
20.991
+0.531
2.6%
jan 1, 2008
23.006
+2.015
9.6%
jan 1, 2009
26.092
+3.086
13.41%
jan 1, 2010
29.383
+3.291
12.61%
jan 1, 2011
27.651
-1.732
-5.89%
jan 1, 2012
29.007
+1.355
4.9%
jan 1, 2013
33.565
+4.559
15.72%
jan 1, 2014
34.655
+1.089
3.25%
jan 1, 2015
34.579
-0.076
-0.22%
jan 1, 2016
36.843
+2.264
6.55%
Ranking of countries by current statistics by years


Comments: