29
/
en
AIzaSyAYiBZKx7MnpbEhh9jyipgxe19OcubqV5w
April 1, 2024
140103
Ghana
GHA
true
2
1
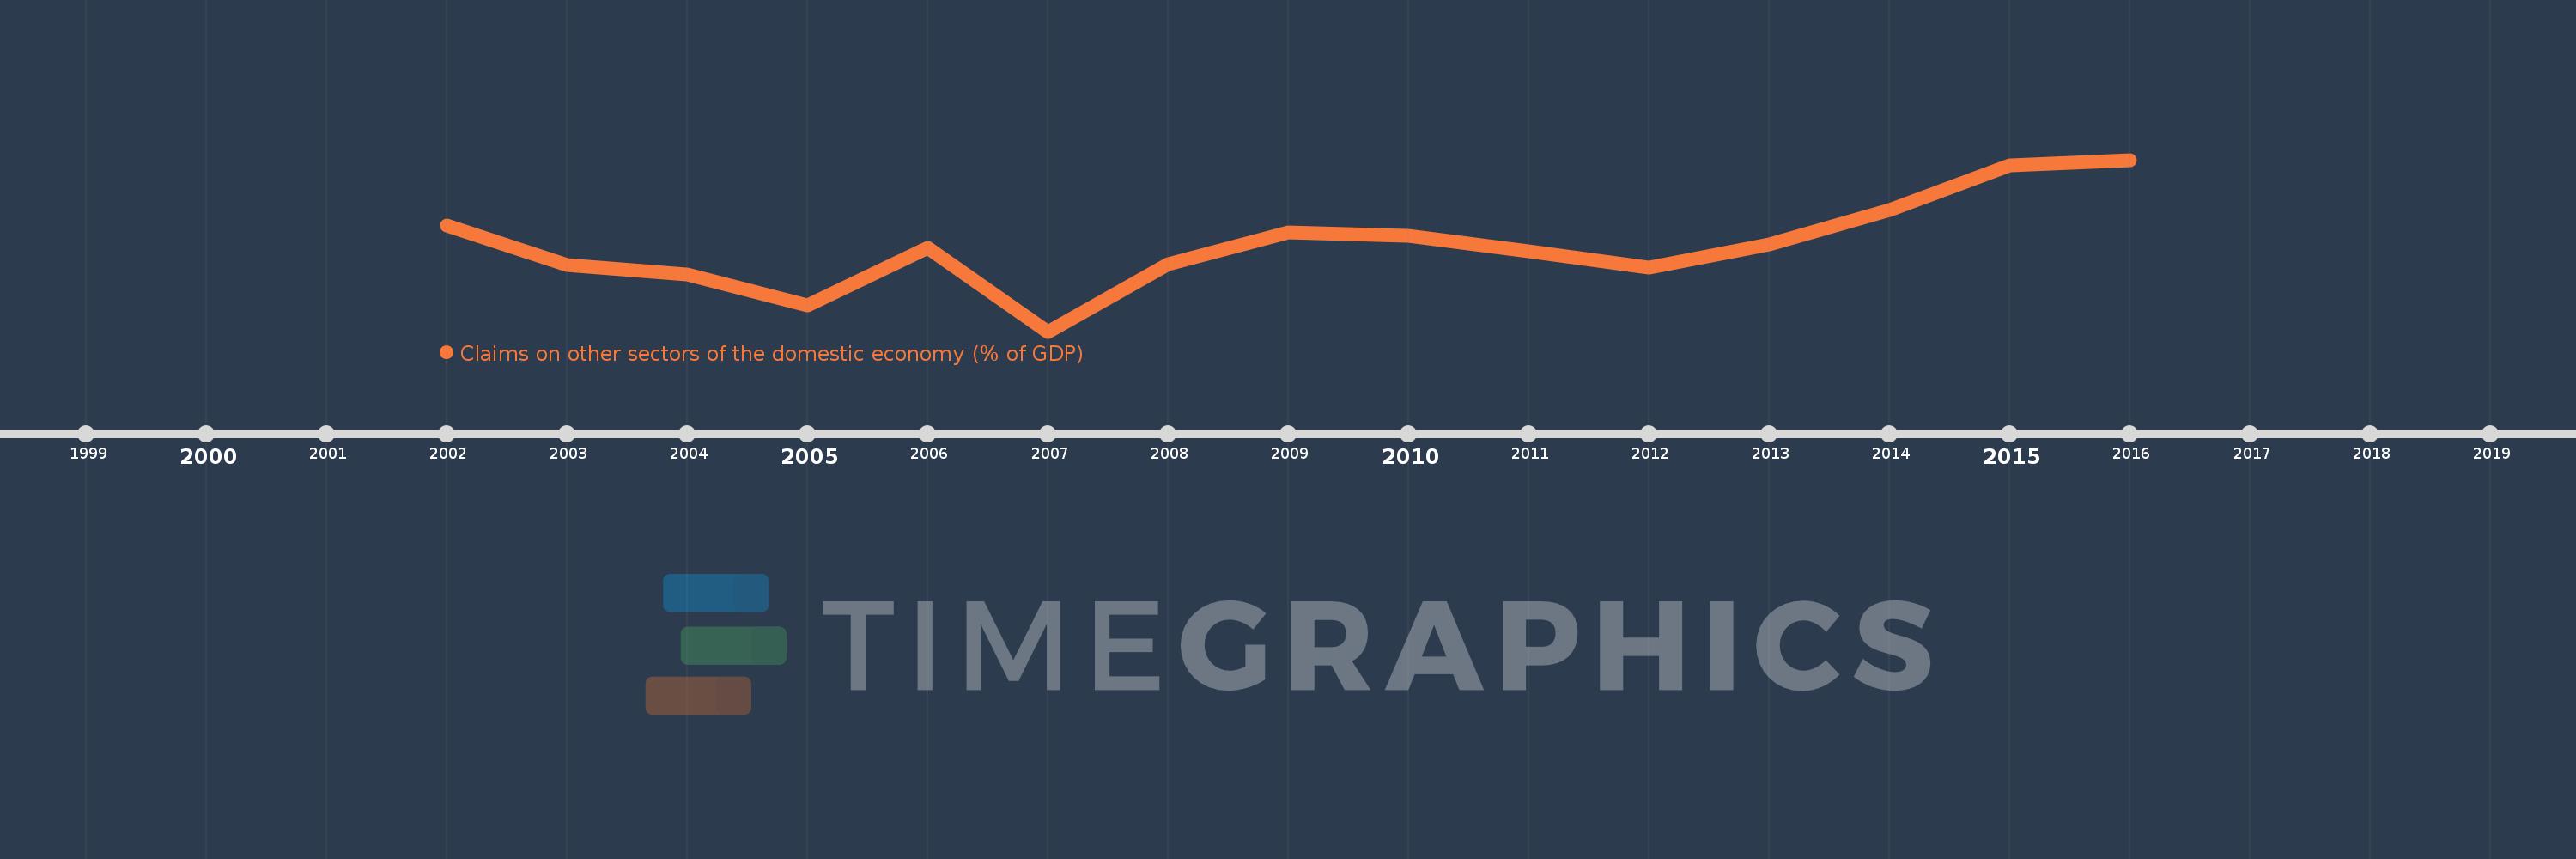
Claims on other sectors of the domestic economy (% of GDP)
2016,2015,2014,2013,2012,2011,2010,2009,2008,2007,2006,2005,2004,2003,2002
This statistics in other country:
Timeline:
This timeline shows a graph from 2002 to 2016 of Ghana. No data until 2001. Number of actual observations by date: 15.
Source name:
World Development Indicators
Source organization:
International Monetary Fund, International Financial Statistics and data files, and World Bank and OECD GDP estimates.
Categories, topics:
Financial Sector
Last updated:
apr 23, 2017
Indicators value changes by year
Minimum:
12.907
jan 1, 2007
Maximum:
23.749
jan 1, 2016
At the date of observation
Value
Absolute change
Change from previous value
jan 1, 2002
19.62
+19.62
0.0%
jan 1, 2003
17.122
-2.498
-12.73%
jan 1, 2004
16.524
-0.598
-3.49%
jan 1, 2005
14.569
-1.956
-11.84%
jan 1, 2006
18.203
+3.634
24.94%
jan 1, 2007
12.907
-5.295
-29.09%
jan 1, 2008
17.15
+4.243
32.87%
jan 1, 2009
19.15
+2.0
11.66%
jan 1, 2010
18.927
-0.223
-1.16%
jan 1, 2011
17.973
-0.954
-5.04%
jan 1, 2012
16.967
-1.006
-5.6%
jan 1, 2013
18.403
+1.436
8.46%
jan 1, 2014
20.568
+2.165
11.76%
jan 1, 2015
23.404
+2.837
13.79%
jan 1, 2016
23.749
+0.344
1.47%
Ranking of countries by current statistics by years


Comments: