29
/
en
AIzaSyAYiBZKx7MnpbEhh9jyipgxe19OcubqV5w
April 1, 2024
29704
Euro area
EMU
false
2
1
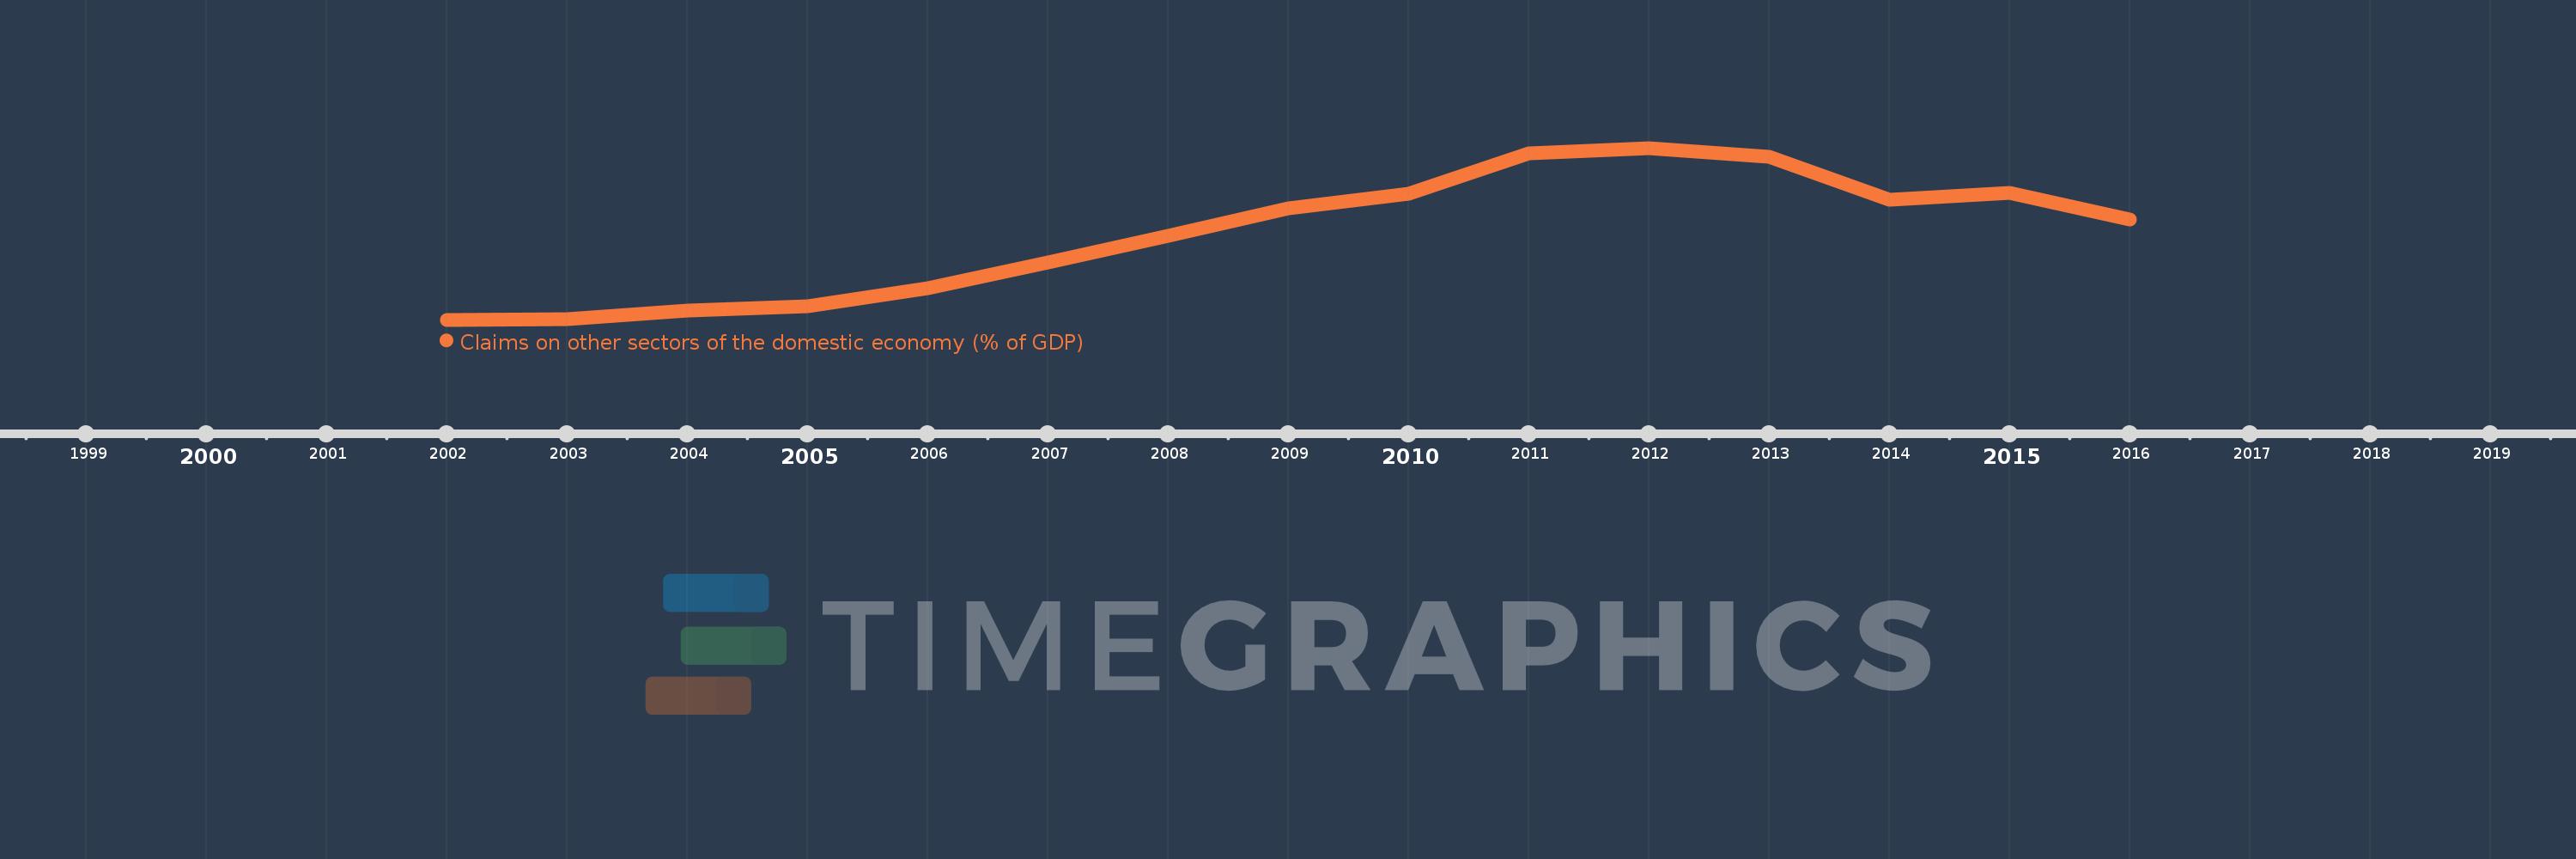
Claims on other sectors of the domestic economy (% of GDP)
2016,2015,2014,2013,2012,2011,2010,2009,2008,2007,2006,2005,2004,2003,2002
This statistics in other country:
Timeline:
This timeline shows a graph from 2002 to 2016 of Euro area. No data until 2001. Number of actual observations by date: 15.
Source name:
World Development Indicators
Source organization:
International Monetary Fund, International Financial Statistics and data files, and World Bank and OECD GDP estimates.
Categories, topics:
Financial Sector
Last updated:
apr 23, 2017
Indicators value changes by year
Minimum:
106.872
jan 1, 2002
Maximum:
160.503
jan 1, 2012
At the date of observation
Value
Absolute change
Change from previous value
jan 1, 2002
106.872
+106.872
0.0%
jan 1, 2003
107.079
+0.207
0.19%
jan 1, 2004
109.84
+2.762
2.58%
jan 1, 2005
111.085
+1.244
1.13%
jan 1, 2006
116.76
+5.676
5.11%
jan 1, 2007
124.703
+7.943
6.8%
jan 1, 2008
132.976
+8.273
6.63%
jan 1, 2009
141.585
+8.609
6.47%
jan 1, 2010
146.159
+4.574
3.23%
jan 1, 2011
158.701
+12.542
8.58%
jan 1, 2012
160.503
+1.802
1.14%
jan 1, 2013
157.611
-2.892
-1.8%
jan 1, 2014
144.351
-13.26
-8.41%
jan 1, 2015
146.509
+2.158
1.49%
jan 1, 2016
138.249
-8.26
-5.64%
Ranking of countries by current statistics by years


Comments: