29
/
en
AIzaSyAYiBZKx7MnpbEhh9jyipgxe19OcubqV5w
April 1, 2024
56080
Small states
SST
false
2
1
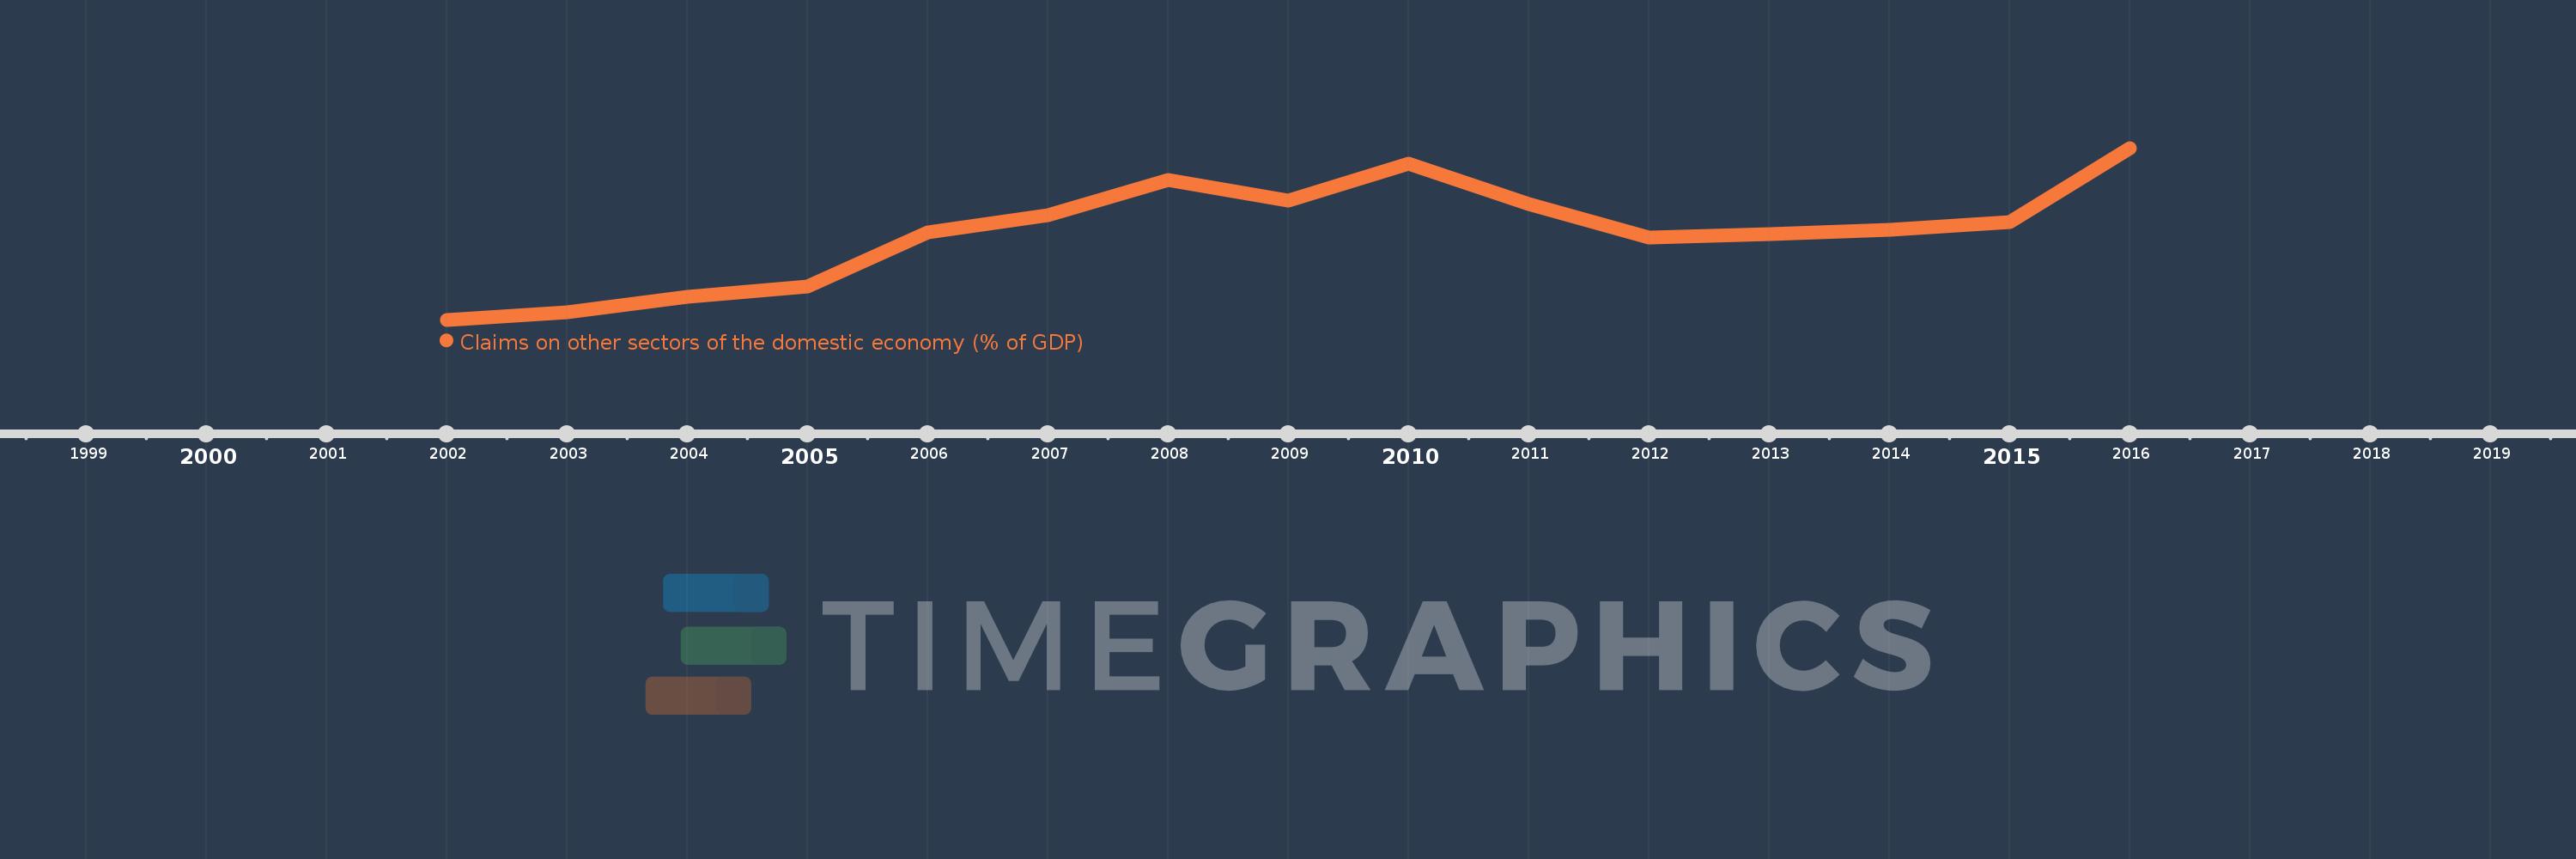
Claims on other sectors of the domestic economy (% of GDP)
2016,2015,2014,2013,2012,2011,2010,2009,2008,2007,2006,2005,2004,2003,2002
This statistics in other country:
Timeline:
This timeline shows a graph from 2002 to 2016 of Small states. No data until 2001. Number of actual observations by date: 15.
Source name:
World Development Indicators
Source organization:
International Monetary Fund, International Financial Statistics and data files, and World Bank and OECD GDP estimates.
Categories, topics:
Financial Sector
Last updated:
apr 23, 2017
Indicators value changes by year
Minimum:
53.989
jan 1, 2002
At the date of observation
Value
Absolute change
Change from previous value
jan 1, 2002
53.989
+53.989
0.0%
jan 1, 2003
55.396
+1.407
2.61%
jan 1, 2004
58.426
+3.03
5.47%
jan 1, 2005
60.367
+1.941
3.32%
jan 1, 2006
70.796
+10.429
17.28%
jan 1, 2007
74.051
+3.255
4.6%
jan 1, 2008
80.853
+6.802
9.19%
jan 1, 2009
76.823
-4.03
-4.98%
jan 1, 2010
84.018
+7.194
9.36%
jan 1, 2011
76.275
-7.742
-9.21%
jan 1, 2012
69.841
-6.435
-8.44%
jan 1, 2013
70.467
+0.626
0.9%
jan 1, 2014
71.348
+0.881
1.25%
jan 1, 2015
72.8
+1.452
2.03%
jan 1, 2016
87.03
+14.23
19.55%
Ranking of countries by current statistics by years


Comments: