29
/
en
AIzaSyAYiBZKx7MnpbEhh9jyipgxe19OcubqV5w
April 1, 2024
94602
Burkina Faso
BFA
true
2
1
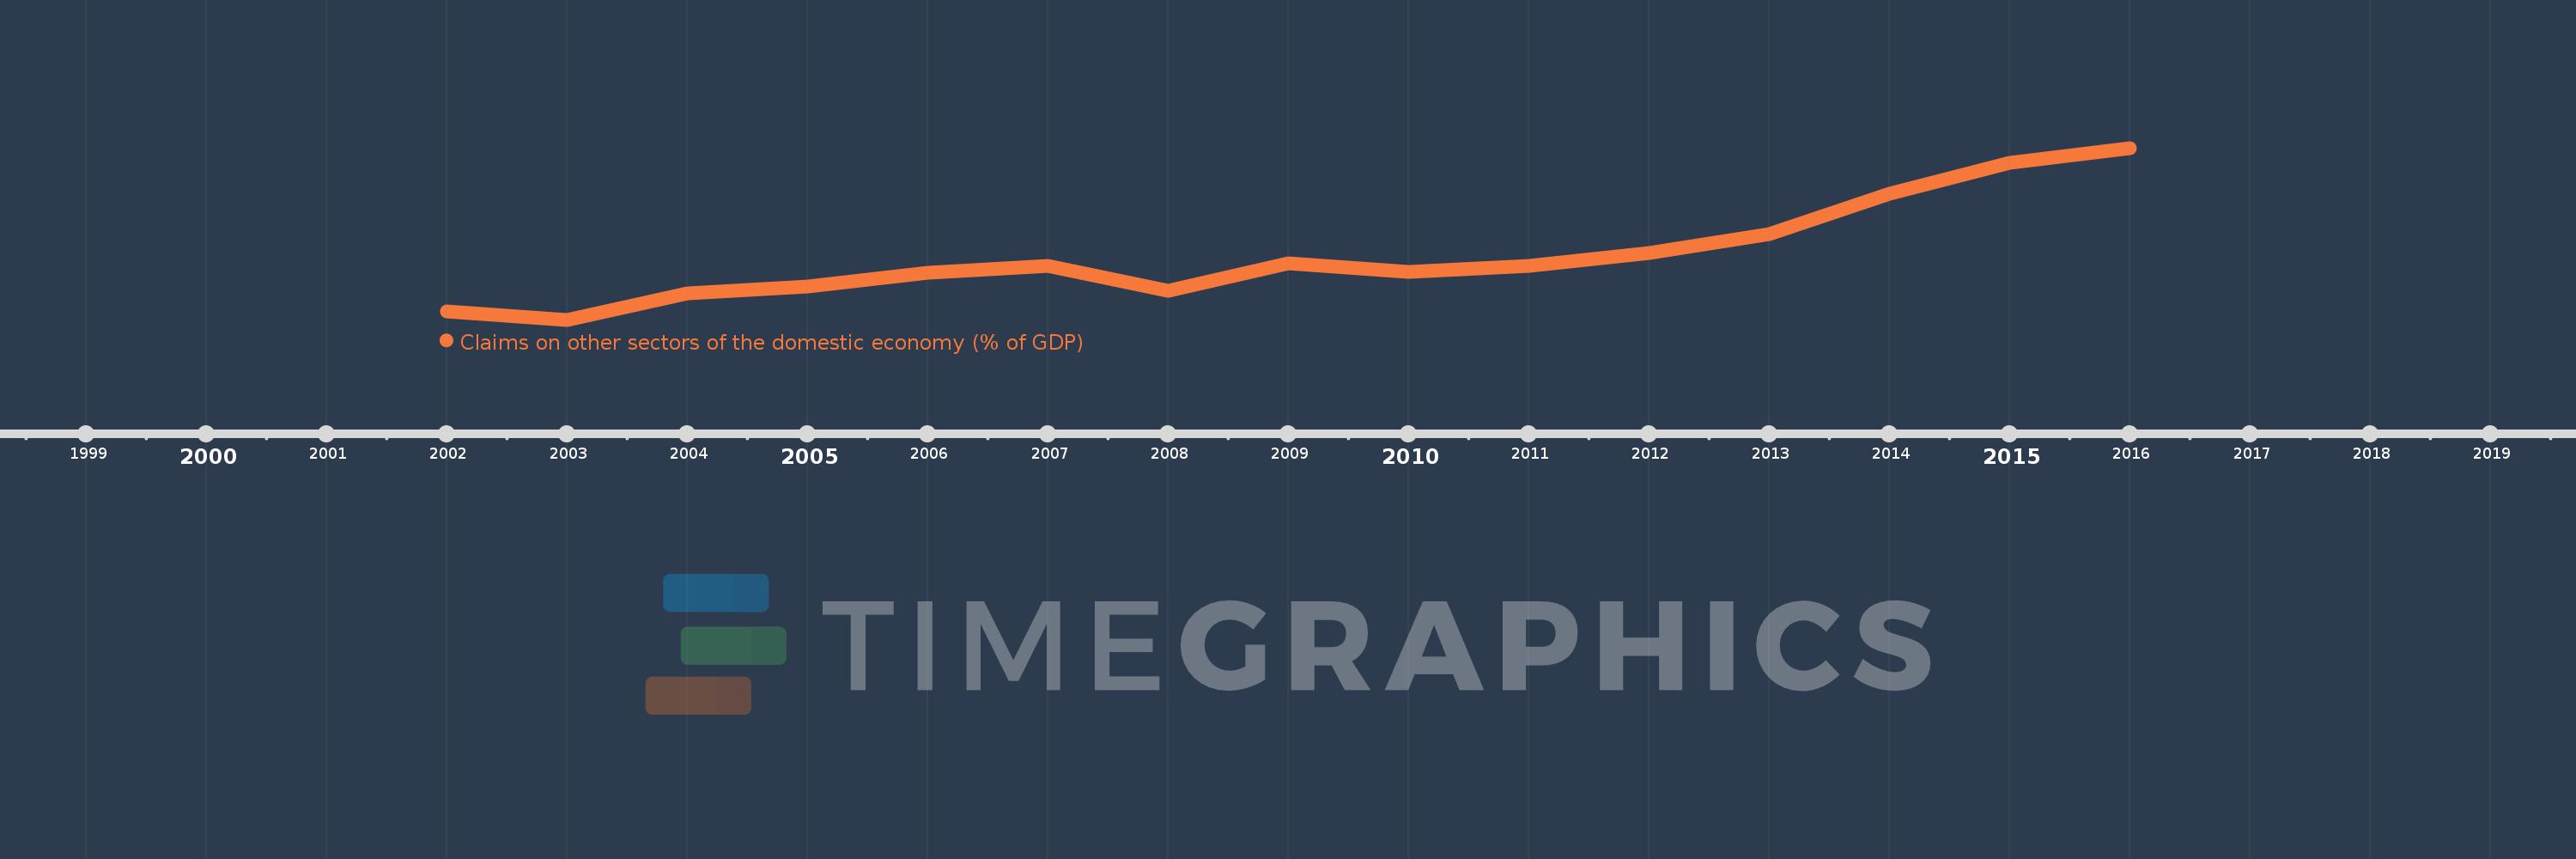
Claims on other sectors of the domestic economy (% of GDP)
2016,2015,2014,2013,2012,2011,2010,2009,2008,2007,2006,2005,2004,2003,2002
This statistics in other country:
Timeline:
This timeline shows a graph from 2002 to 2016 of Burkina Faso. No data until 2001. Number of actual observations by date: 15.
Source name:
World Development Indicators
Source organization:
International Monetary Fund, International Financial Statistics and data files, and World Bank and OECD GDP estimates.
Categories, topics:
Financial Sector
Last updated:
apr 23, 2017
Indicators value changes by year
Maximum:
31.216
jan 1, 2016
At the date of observation
Value
Absolute change
Change from previous value
jan 1, 2002
12.449
+12.449
0.0%
jan 1, 2003
11.49
-0.959
-7.71%
jan 1, 2004
14.475
+2.985
25.98%
jan 1, 2005
15.315
+0.84
5.8%
jan 1, 2006
16.843
+1.528
9.98%
jan 1, 2007
17.671
+0.828
4.92%
jan 1, 2008
14.825
-2.846
-16.1%
jan 1, 2009
17.98
+3.154
21.28%
jan 1, 2010
16.993
-0.986
-5.49%
jan 1, 2011
17.712
+0.718
4.23%
jan 1, 2012
19.179
+1.467
8.28%
jan 1, 2013
21.354
+2.175
11.34%
jan 1, 2014
25.91
+4.557
21.34%
jan 1, 2015
29.462
+3.551
13.71%
jan 1, 2016
31.216
+1.755
5.96%
Ranking of countries by current statistics by years


Comments: