29
/
en
AIzaSyAYiBZKx7MnpbEhh9jyipgxe19OcubqV5w
April 1, 2024
269063
Turkey
TUR
true
2
1
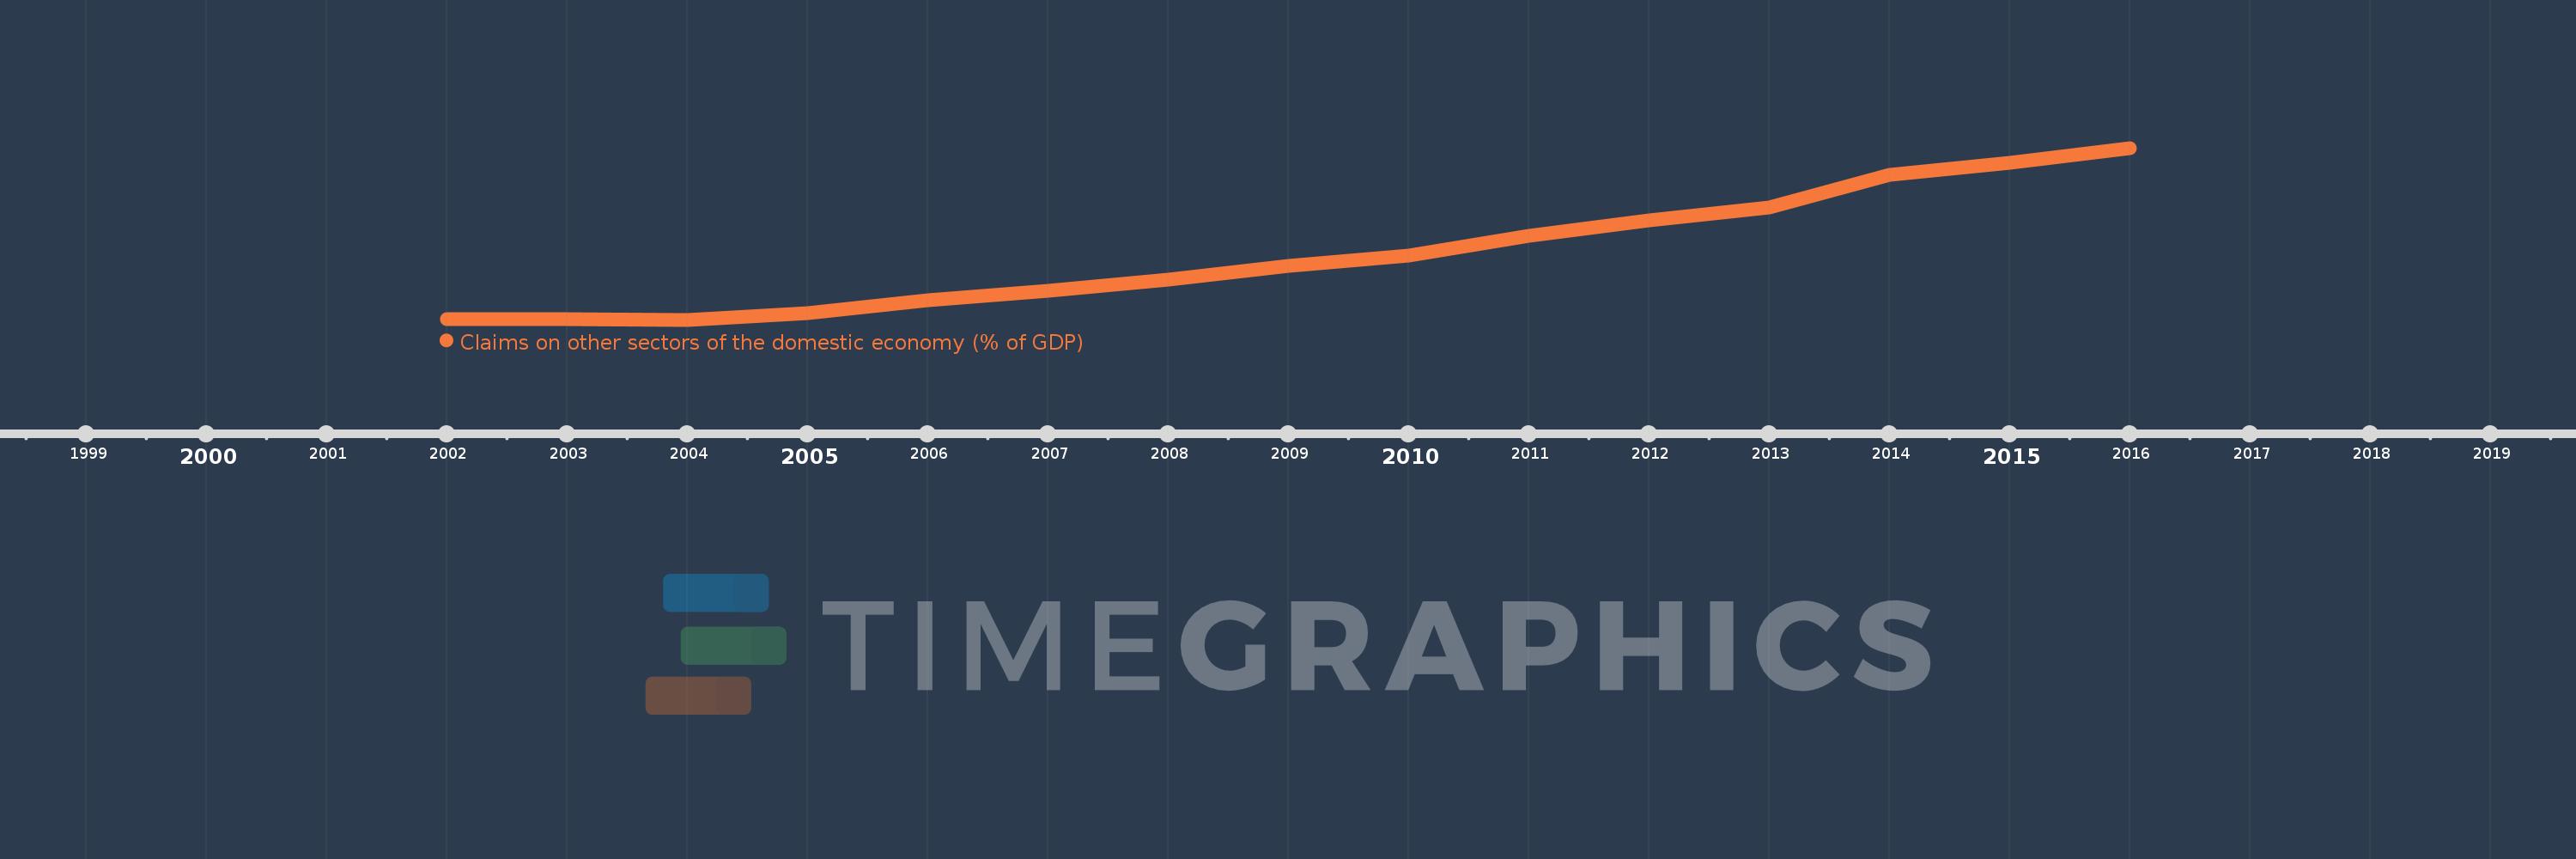
Claims on other sectors of the domestic economy (% of GDP)
2016,2015,2014,2013,2012,2011,2010,2009,2008,2007,2006,2005,2004,2003,2002
This statistics in other country:
Timeline:
This timeline shows a graph from 2002 to 2016 of Turkey. No data until 2001. Number of actual observations by date: 15.
Source name:
World Development Indicators
Source organization:
International Monetary Fund, International Financial Statistics and data files, and World Bank and OECD GDP estimates.
Categories, topics:
Financial Sector
Last updated:
apr 23, 2017
Indicators value changes by year
Maximum:
81.128
jan 1, 2016
At the date of observation
Value
Absolute change
Change from previous value
jan 1, 2002
16.685
+16.685
0.0%
jan 1, 2003
16.497
-0.189
-1.13%
jan 1, 2004
16.3
-0.197
-1.19%
jan 1, 2005
18.696
+2.396
14.7%
jan 1, 2006
23.591
+4.895
26.18%
jan 1, 2007
27.354
+3.762
15.95%
jan 1, 2008
31.397
+4.044
14.78%
jan 1, 2009
36.478
+5.081
16.18%
jan 1, 2010
40.368
+3.889
10.66%
jan 1, 2011
48.073
+7.705
19.09%
jan 1, 2012
53.887
+5.815
12.1%
jan 1, 2013
58.671
+4.783
8.88%
jan 1, 2014
71.046
+12.375
21.09%
jan 1, 2015
75.532
+4.486
6.31%
jan 1, 2016
81.128
+5.596
7.41%
Ranking of countries by current statistics by years


Comments: