29
/
en
AIzaSyAYiBZKx7MnpbEhh9jyipgxe19OcubqV5w
April 1, 2024
150087
Honduras
HND
true
2
1
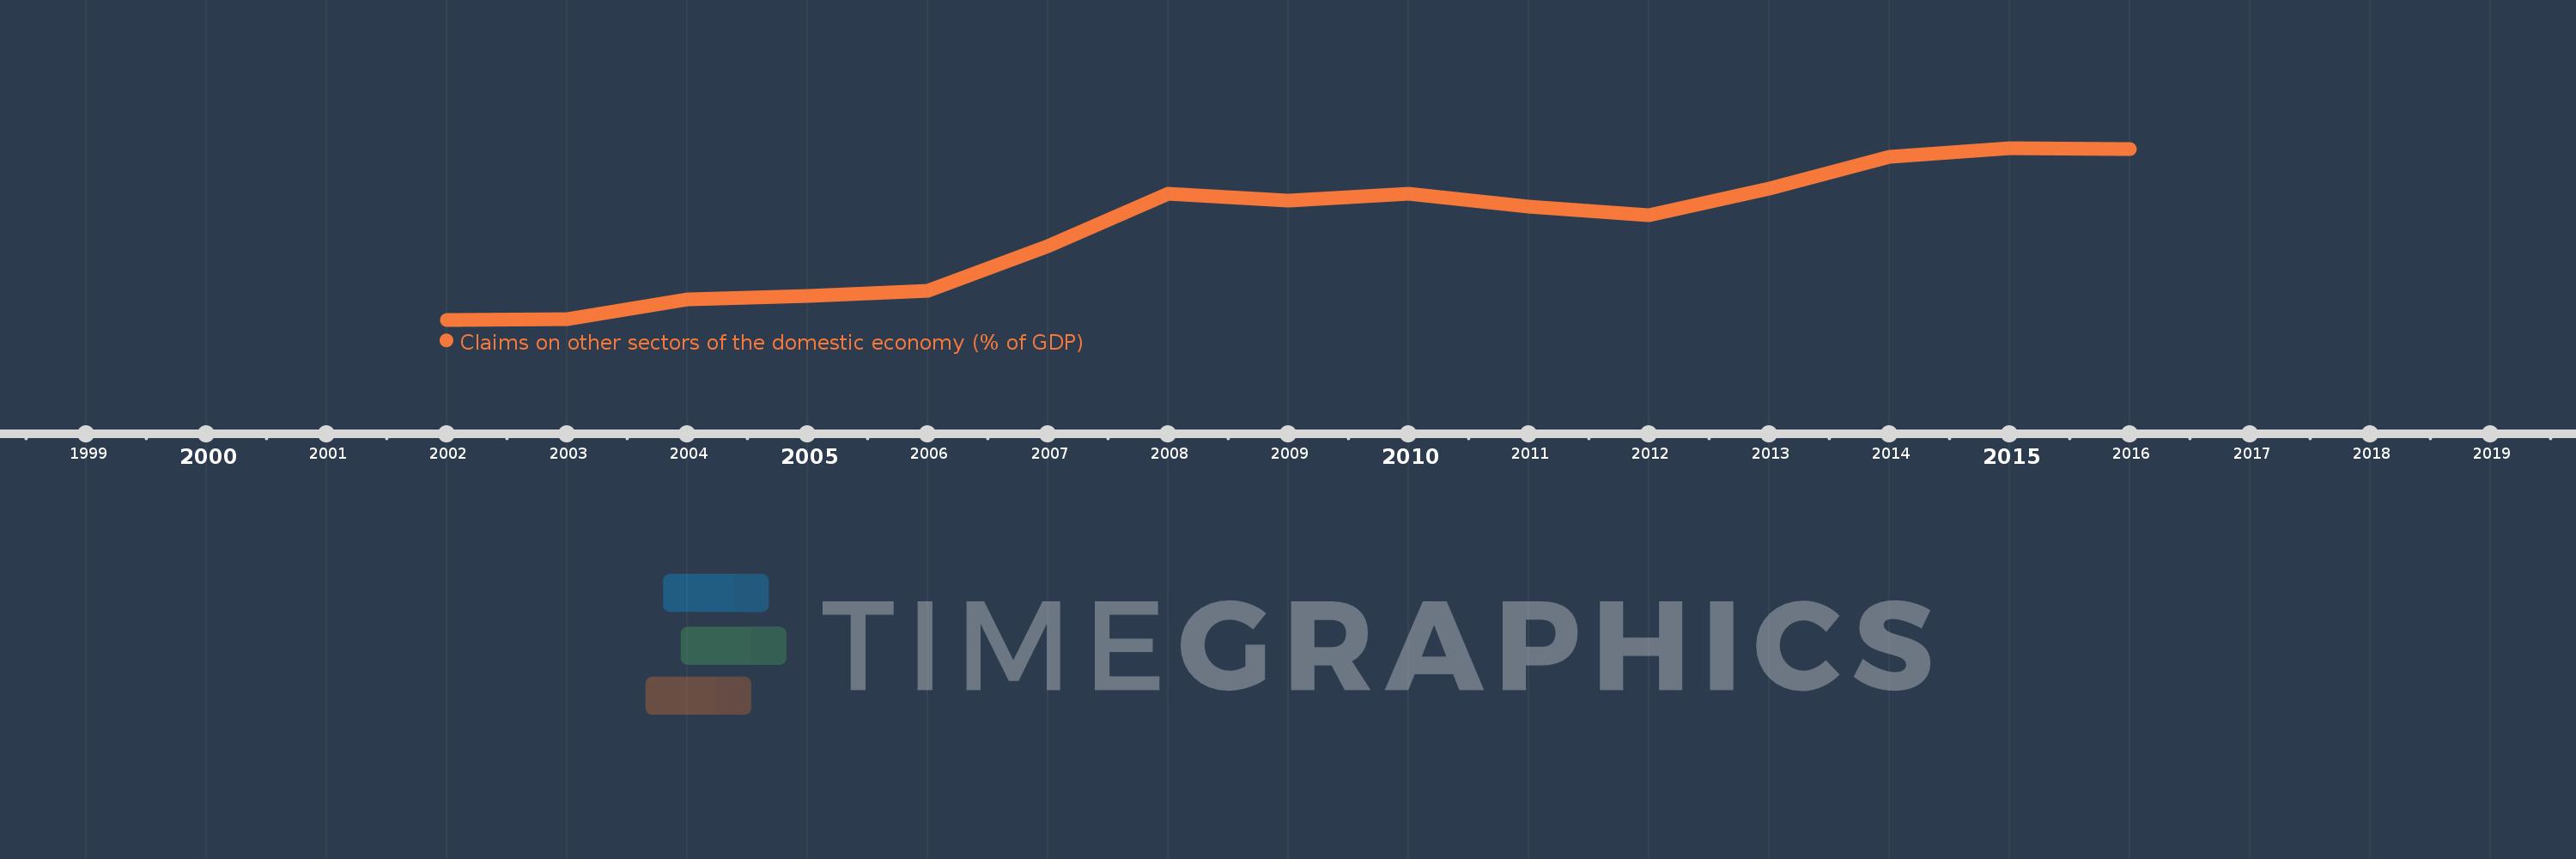
Claims on other sectors of the domestic economy (% of GDP)
2016,2015,2014,2013,2012,2011,2010,2009,2008,2007,2006,2005,2004,2003,2002
This statistics in other country:
Timeline:
This timeline shows a graph from 2002 to 2016 of Honduras. No data until 2001. Number of actual observations by date: 15.
Source name:
World Development Indicators
Source organization:
International Monetary Fund, International Financial Statistics and data files, and World Bank and OECD GDP estimates.
Categories, topics:
Financial Sector
Last updated:
apr 23, 2017
Indicators value changes by year
Minimum:
36.834
jan 1, 2002
Maximum:
61.136
jan 1, 2015
At the date of observation
Value
Absolute change
Change from previous value
jan 1, 2002
36.834
+36.834
0.0%
jan 1, 2003
36.964
+0.13
0.35%
jan 1, 2004
39.689
+2.725
7.37%
jan 1, 2005
40.183
+0.494
1.24%
jan 1, 2006
40.942
+0.759
1.89%
jan 1, 2007
47.269
+6.327
15.45%
jan 1, 2008
54.662
+7.393
15.64%
jan 1, 2009
53.663
-1.0
-1.83%
jan 1, 2010
54.71
+1.047
1.95%
jan 1, 2011
52.782
-1.928
-3.52%
jan 1, 2012
51.574
-1.208
-2.29%
jan 1, 2013
55.359
+3.785
7.34%
jan 1, 2014
59.865
+4.505
8.14%
jan 1, 2015
61.136
+1.271
2.12%
jan 1, 2016
61.004
-0.132
-0.22%
Ranking of countries by current statistics by years


Comments: