29
/
en
AIzaSyAYiBZKx7MnpbEhh9jyipgxe19OcubqV5w
April 1, 2024
170703
Kosovo
XKX
true
2
1
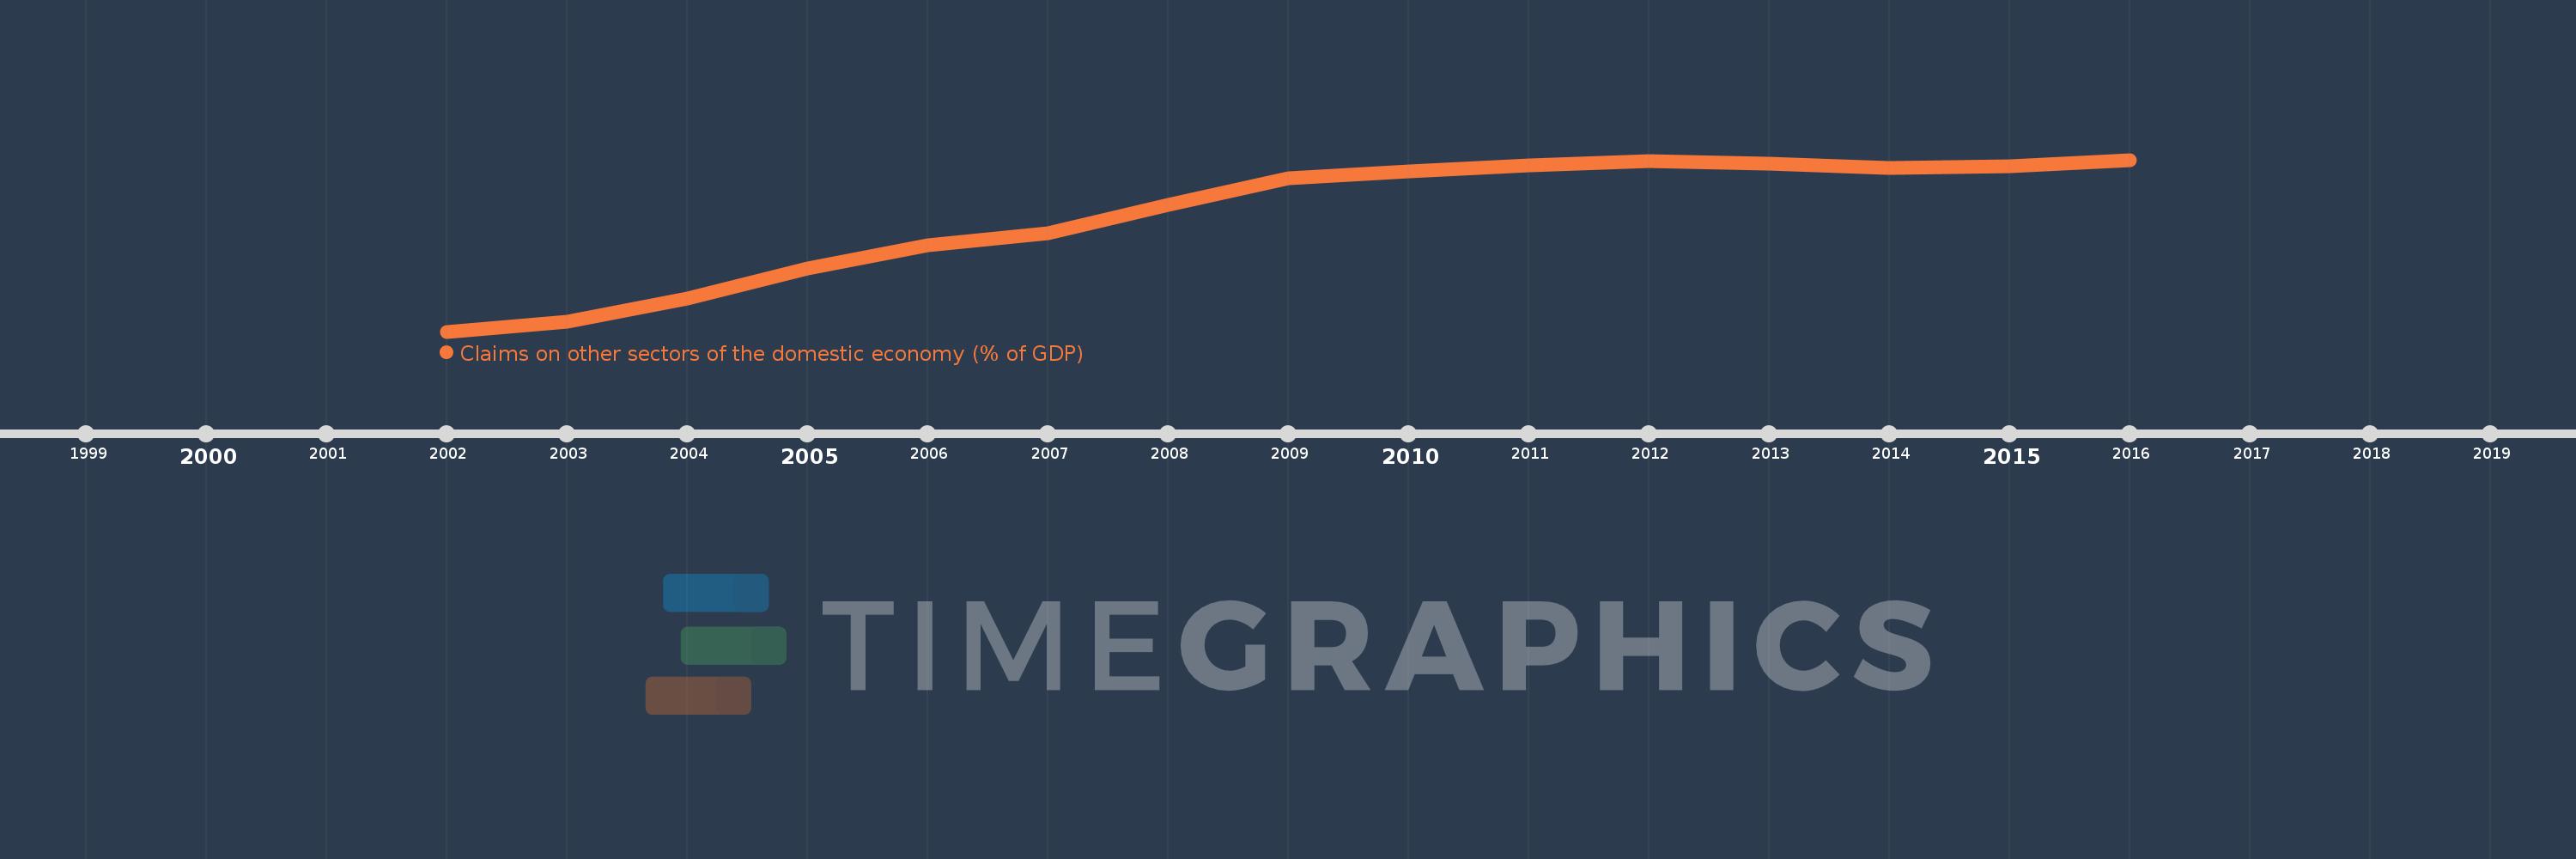
Claims on other sectors of the domestic economy (% of GDP)
2016,2015,2014,2013,2012,2011,2010,2009,2008,2007,2006,2005,2004,2003,2002
This statistics in other country:
Timeline:
This timeline shows a graph from 2002 to 2016 of Kosovo. No data until 2001. Number of actual observations by date: 15.
Source name:
World Development Indicators
Source organization:
International Monetary Fund, International Financial Statistics and data files, and World Bank and OECD GDP estimates.
Categories, topics:
Financial Sector
Last updated:
apr 23, 2017
Indicators value changes by year
Maximum:
36.679
jan 1, 2016
At the date of observation
Value
Absolute change
Change from previous value
jan 1, 2002
0.916
+0.916
0.0%
jan 1, 2003
3.023
+2.107
230.15%
jan 1, 2004
7.846
+4.823
159.56%
jan 1, 2005
14.125
+6.279
80.03%
jan 1, 2006
18.823
+4.698
33.26%
jan 1, 2007
21.36
+2.537
13.48%
jan 1, 2008
27.353
+5.993
28.06%
jan 1, 2009
32.883
+5.531
20.22%
jan 1, 2010
34.35
+1.467
4.46%
jan 1, 2011
35.575
+1.225
3.57%
jan 1, 2012
36.441
+0.866
2.44%
jan 1, 2013
35.963
-0.478
-1.31%
jan 1, 2014
34.939
-1.024
-2.85%
jan 1, 2015
35.421
+0.482
1.38%
jan 1, 2016
36.679
+1.258
3.55%
Ranking of countries by current statistics by years


Comments: