29
/it/
it
AIzaSyAYiBZKx7MnpbEhh9jyipgxe19OcubqV5w
April 1, 2024
79258
Barbados
BRB
true
2
1
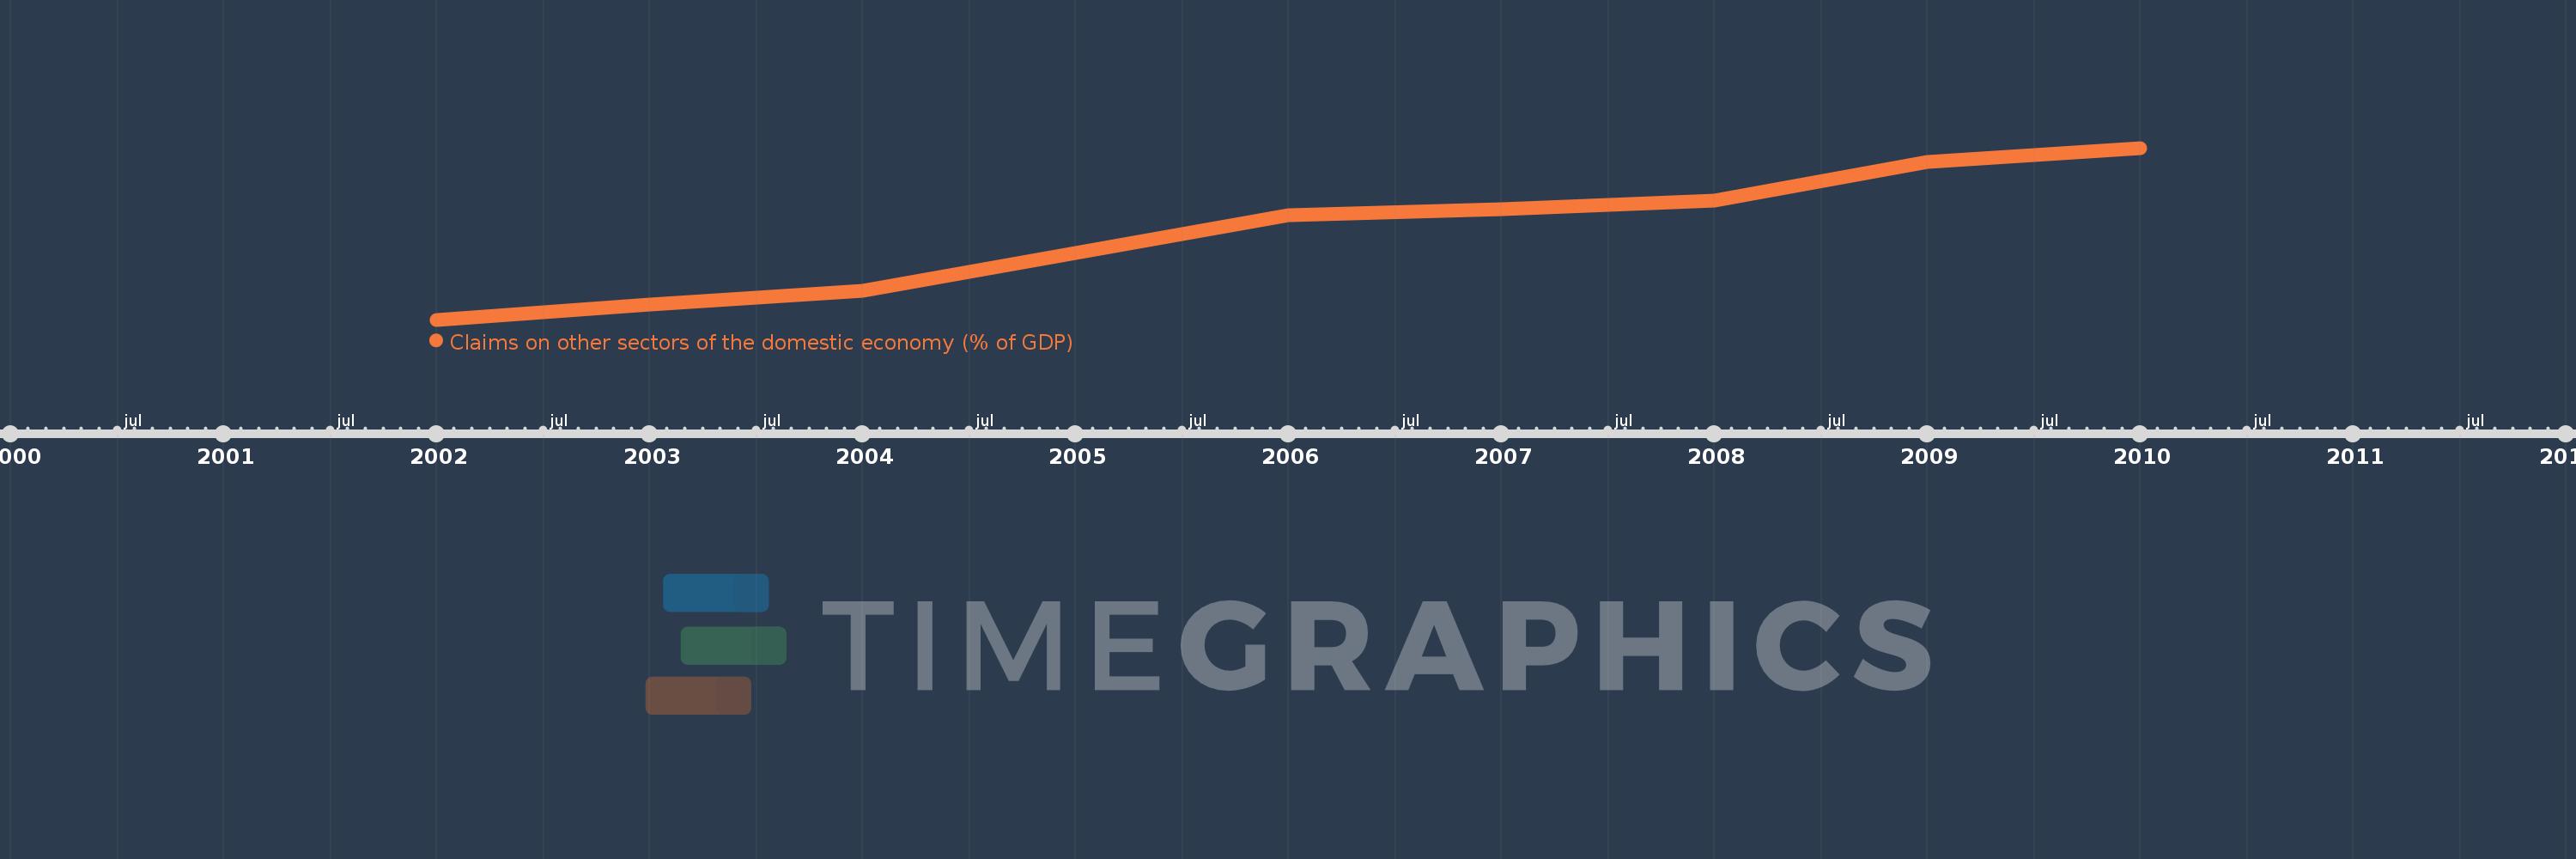
Claims on other sectors of the domestic economy (% of GDP)
2010,2009,2008,2007,2006,2005,2004,2003,2002
Queste statistiche in altri paesi:
Linea del tempo:
Questa scala temporale mostra un grafico dal 2002 anno al 2010 anno. Barbados. I dati fino ad 2001 anno non disponibili. Il numero di osservazioni attuali secondo i date: 9.
La fonte (nome):
Indicatori dello sviluppo mondiale
La fonte (organizzazione):
International Monetary Fund, International Financial Statistics and data files, and World Bank and OECD GDP estimates.
Categorie:
Financial Sector
sono stati aggiornati
23 apr 2017 anni
Indicatori delle variazioni dei valori per anni
Minima:
62.204
1 gen 2002 anni
Massimo:
91.599
1 gen 2010 anni
Alla data di osservazione
Valore
Variazione assoluta
La variazione rispetto al valore precedente
1 gen 2002 anni
62.204
+62.204
0.0%
1 gen 2003 anni
64.846
+2.642
4.25%
1 gen 2004 anni
67.157
+2.311
3.56%
1 gen 2005 anni
73.653
+6.495
9.67%
1 gen 2006 anni
80.109
+6.456
8.77%
1 gen 2007 anni
81.181
+1.072
1.34%
1 gen 2008 anni
82.54
+1.36
1.68%
1 gen 2009 anni
89.144
+6.604
8.0%
1 gen 2010 anni
91.599
+2.455
2.75%
Classificazione dei paesi secondo i statistiche attuali per anni


Commenti: