29
/it/
it
AIzaSyAYiBZKx7MnpbEhh9jyipgxe19OcubqV5w
April 1, 2024
55368
Pre-demographic dividend
PRE
false
2
1
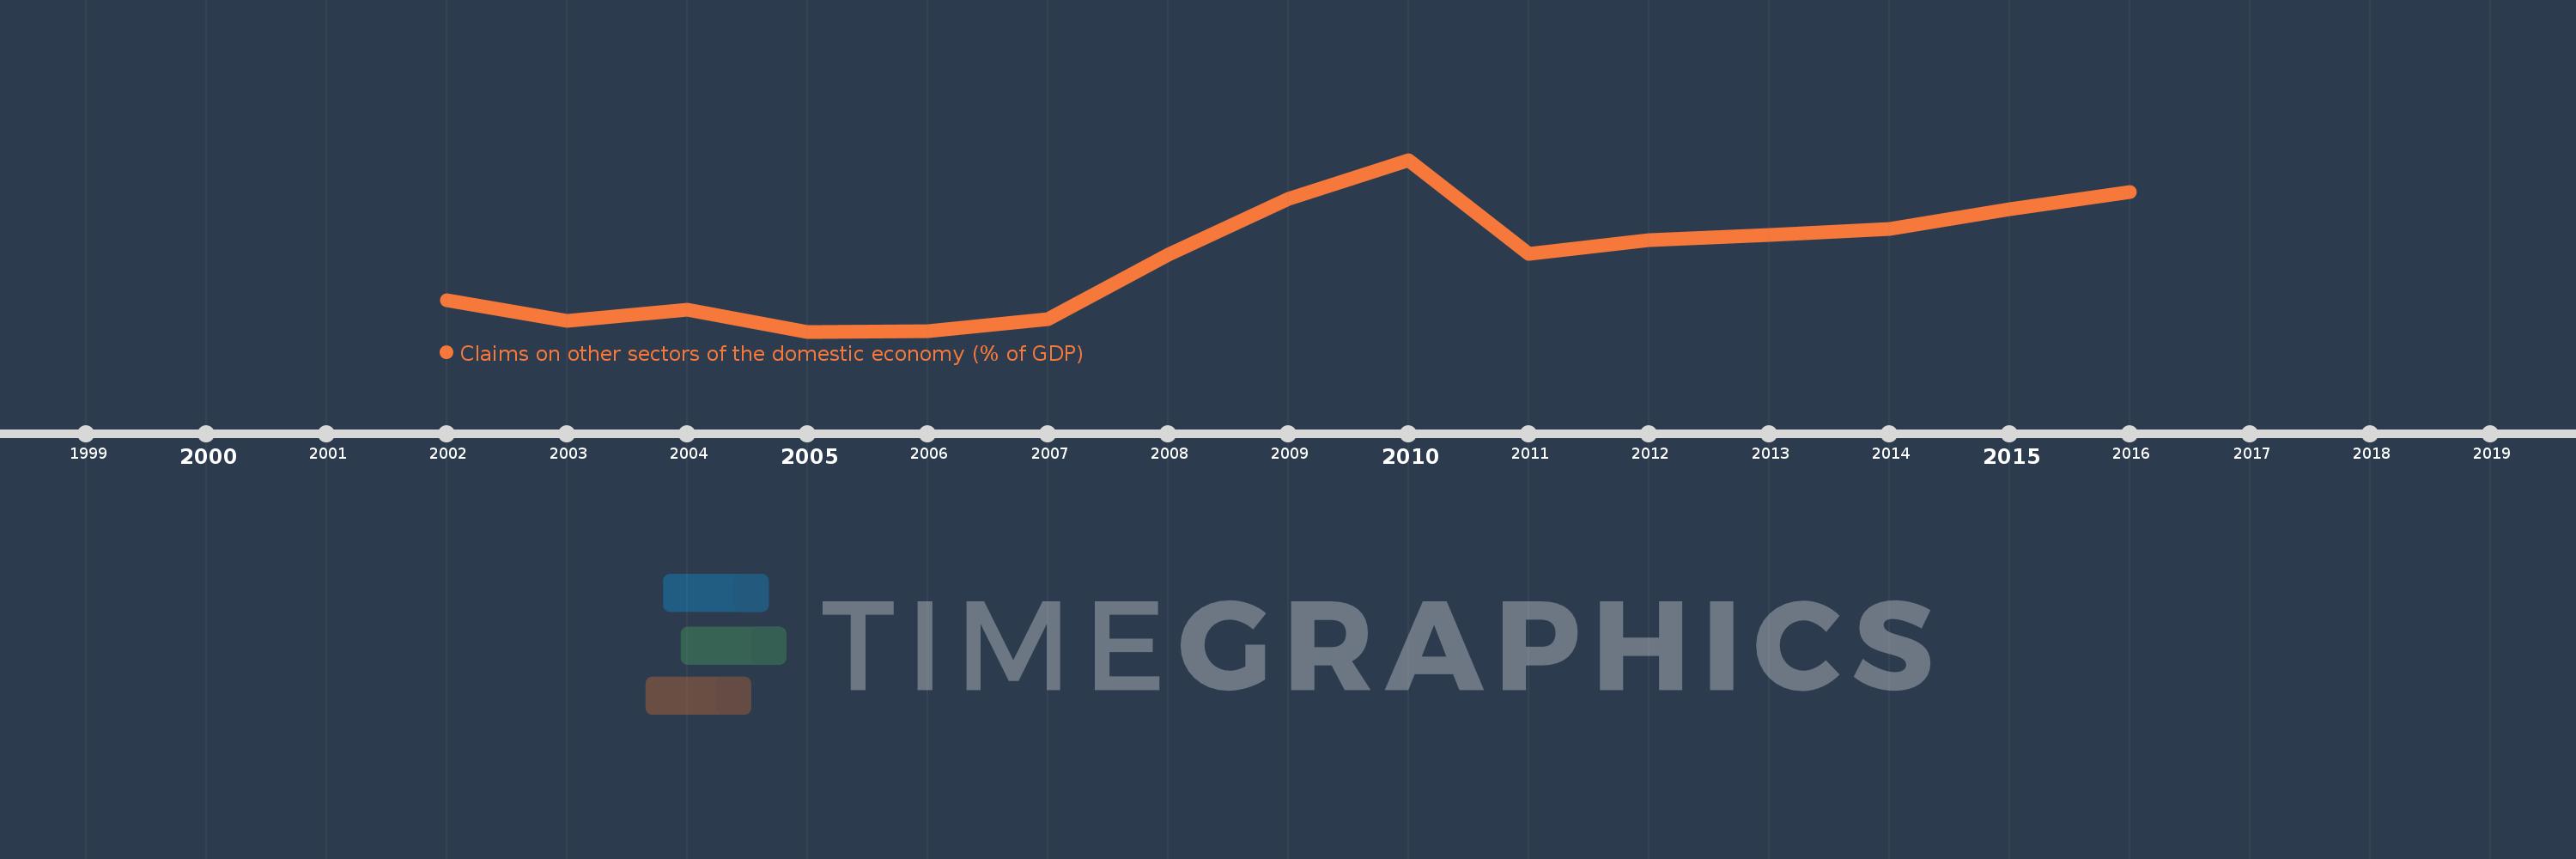
Claims on other sectors of the domestic economy (% of GDP)
2016,2015,2014,2013,2012,2011,2010,2009,2008,2007,2006,2005,2004,2003,2002
Queste statistiche in altri paesi:
Linea del tempo:
Questa scala temporale mostra un grafico dal 2002 anno al 2016 anno. Pre-demographic dividend. I dati fino ad 2001 anno non disponibili. Il numero di osservazioni attuali secondo i date: 15.
La fonte (nome):
Indicatori dello sviluppo mondiale
La fonte (organizzazione):
International Monetary Fund, International Financial Statistics and data files, and World Bank and OECD GDP estimates.
Categorie:
Financial Sector
sono stati aggiornati
23 apr 2017 anni
Indicatori delle variazioni dei valori per anni
Minima:
10.793
1 gen 2005 anni
Massimo:
21.332
1 gen 2010 anni
Alla data di osservazione
Valore
Variazione assoluta
La variazione rispetto al valore precedente
1 gen 2002 anni
12.707
+12.707
0.0%
1 gen 2003 anni
11.463
-1.245
-9.8%
1 gen 2004 anni
12.118
+0.655
5.72%
1 gen 2005 anni
10.793
-1.325
-10.93%
1 gen 2006 anni
10.832
+0.039
0.36%
1 gen 2007 anni
11.55
+0.718
6.63%
1 gen 2008 anni
15.49
+3.94
34.11%
1 gen 2009 anni
18.926
+3.436
22.18%
1 gen 2010 anni
21.332
+2.407
12.72%
1 gen 2011 anni
15.581
-5.751
-26.96%
1 gen 2012 anni
16.391
+0.81
5.2%
1 gen 2013 anni
16.712
+0.321
1.96%
1 gen 2014 anni
17.101
+0.389
2.33%
1 gen 2015 anni
18.281
+1.18
6.9%
1 gen 2016 anni
19.337
+1.056
5.78%
Classificazione dei paesi secondo i statistiche attuali per anni


Commenti: