29
/it/
it
AIzaSyAYiBZKx7MnpbEhh9jyipgxe19OcubqV5w
April 1, 2024
193968
Mauritius
MUS
true
2
1
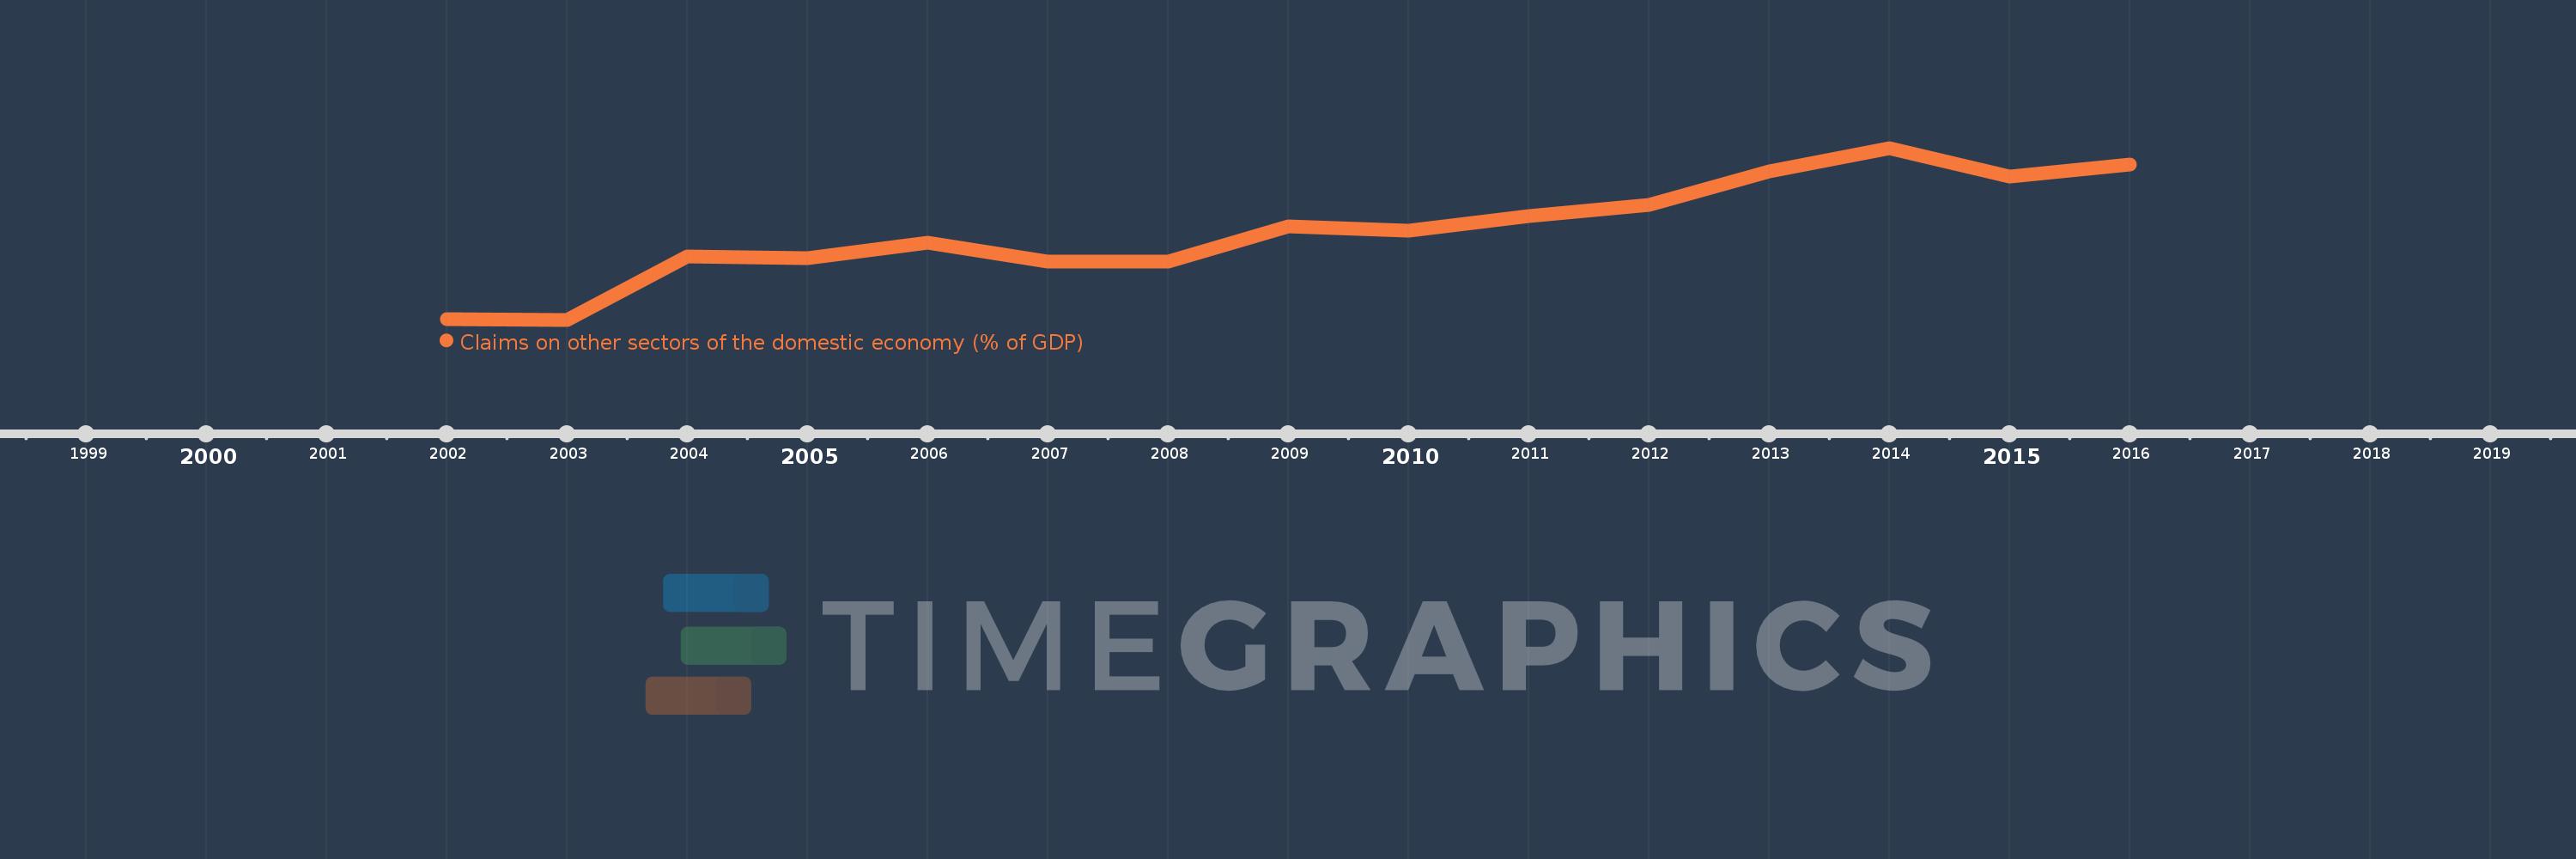
Claims on other sectors of the domestic economy (% of GDP)
2016,2015,2014,2013,2012,2011,2010,2009,2008,2007,2006,2005,2004,2003,2002
Queste statistiche in altri paesi:
Linea del tempo:
Questa scala temporale mostra un grafico dal 2002 anno al 2016 anno. Mauritius. I dati fino ad 2001 anno non disponibili. Il numero di osservazioni attuali secondo i date: 15.
La fonte (nome):
Indicatori dello sviluppo mondiale
La fonte (organizzazione):
International Monetary Fund, International Financial Statistics and data files, and World Bank and OECD GDP estimates.
Categorie:
Financial Sector
sono stati aggiornati
23 apr 2017 anni
Indicatori delle variazioni dei valori per anni
Minima:
59.604
1 gen 2003 anni
Massimo:
111.015
1 gen 2014 anni
Alla data di osservazione
Valore
Variazione assoluta
La variazione rispetto al valore precedente
1 gen 2002 anni
59.781
+59.781
0.0%
1 gen 2003 anni
59.604
-0.177
-0.3%
1 gen 2004 anni
78.54
+18.936
31.77%
1 gen 2005 anni
77.927
-0.613
-0.78%
1 gen 2006 anni
82.786
+4.859
6.24%
1 gen 2007 anni
77.097
-5.689
-6.87%
1 gen 2008 anni
77.06
-0.037
-0.05%
1 gen 2009 anni
87.644
+10.584
13.73%
1 gen 2010 anni
86.141
-1.503
-1.71%
1 gen 2011 anni
90.601
+4.46
5.18%
1 gen 2012 anni
94.097
+3.496
3.86%
1 gen 2013 anni
103.887
+9.79
10.4%
1 gen 2014 anni
111.015
+7.128
6.86%
1 gen 2015 anni
102.544
-8.471
-7.63%
1 gen 2016 anni
106.141
+3.597
3.51%
Classificazione dei paesi secondo i statistiche attuali per anni


Commenti: