29
/it/
it
AIzaSyAYiBZKx7MnpbEhh9jyipgxe19OcubqV5w
April 1, 2024
227218
Qatar
QAT
true
2
1
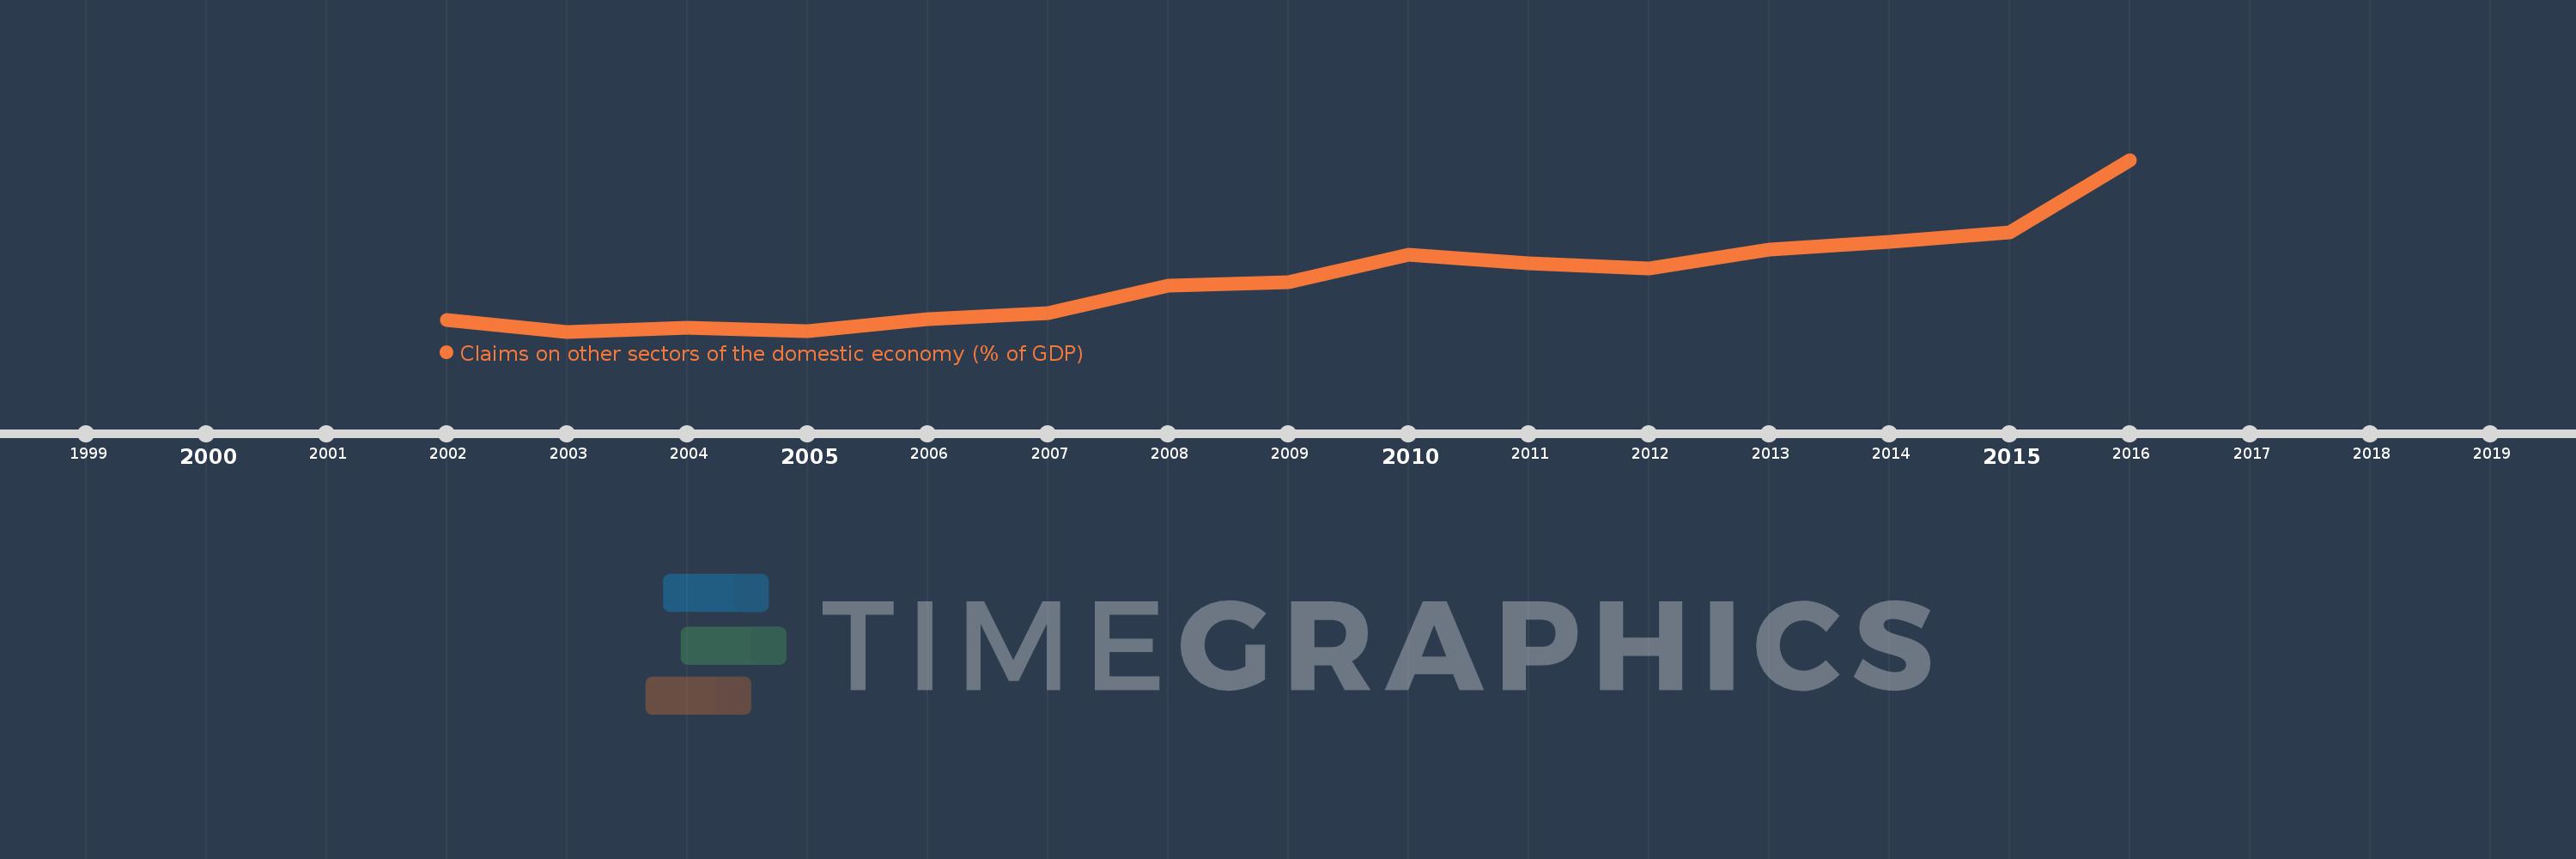
Claims on other sectors of the domestic economy (% of GDP)
2016,2015,2014,2013,2012,2011,2010,2009,2008,2007,2006,2005,2004,2003,2002
Queste statistiche in altri paesi:
Linea del tempo:
Questa scala temporale mostra un grafico dal 2002 anno al 2016 anno. Qatar. I dati fino ad 2001 anno non disponibili. Il numero di osservazioni attuali secondo i date: 15.
La fonte (nome):
Indicatori dello sviluppo mondiale
La fonte (organizzazione):
International Monetary Fund, International Financial Statistics and data files, and World Bank and OECD GDP estimates.
Categorie:
Financial Sector
sono stati aggiornati
23 apr 2017 anni
Indicatori delle variazioni dei valori per anni
Minima:
32.896
1 gen 2003 anni
Massimo:
99.789
1 gen 2016 anni
Alla data di osservazione
Valore
Variazione assoluta
La variazione rispetto al valore precedente
1 gen 2002 anni
37.351
+37.351
0.0%
1 gen 2003 anni
32.896
-4.455
-11.93%
1 gen 2004 anni
34.272
+1.375
4.18%
1 gen 2005 anni
33.091
-1.181
-3.45%
1 gen 2006 anni
37.878
+4.787
14.47%
1 gen 2007 anni
40.048
+2.17
5.73%
1 gen 2008 anni
50.797
+10.75
26.84%
1 gen 2009 anni
52.095
+1.297
2.55%
1 gen 2010 anni
62.9
+10.806
20.74%
1 gen 2011 anni
59.359
-3.542
-5.63%
1 gen 2012 anni
57.5
-1.859
-3.13%
1 gen 2013 anni
64.682
+7.182
12.49%
1 gen 2014 anni
67.905
+3.224
4.98%
1 gen 2015 anni
71.406
+3.5
5.15%
1 gen 2016 anni
99.789
+28.384
39.75%
Classificazione dei paesi secondo i statistiche attuali per anni


Commenti: