29
/it/
it
AIzaSyAYiBZKx7MnpbEhh9jyipgxe19OcubqV5w
April 1, 2024
163570
Japan
JPN
true
2
1
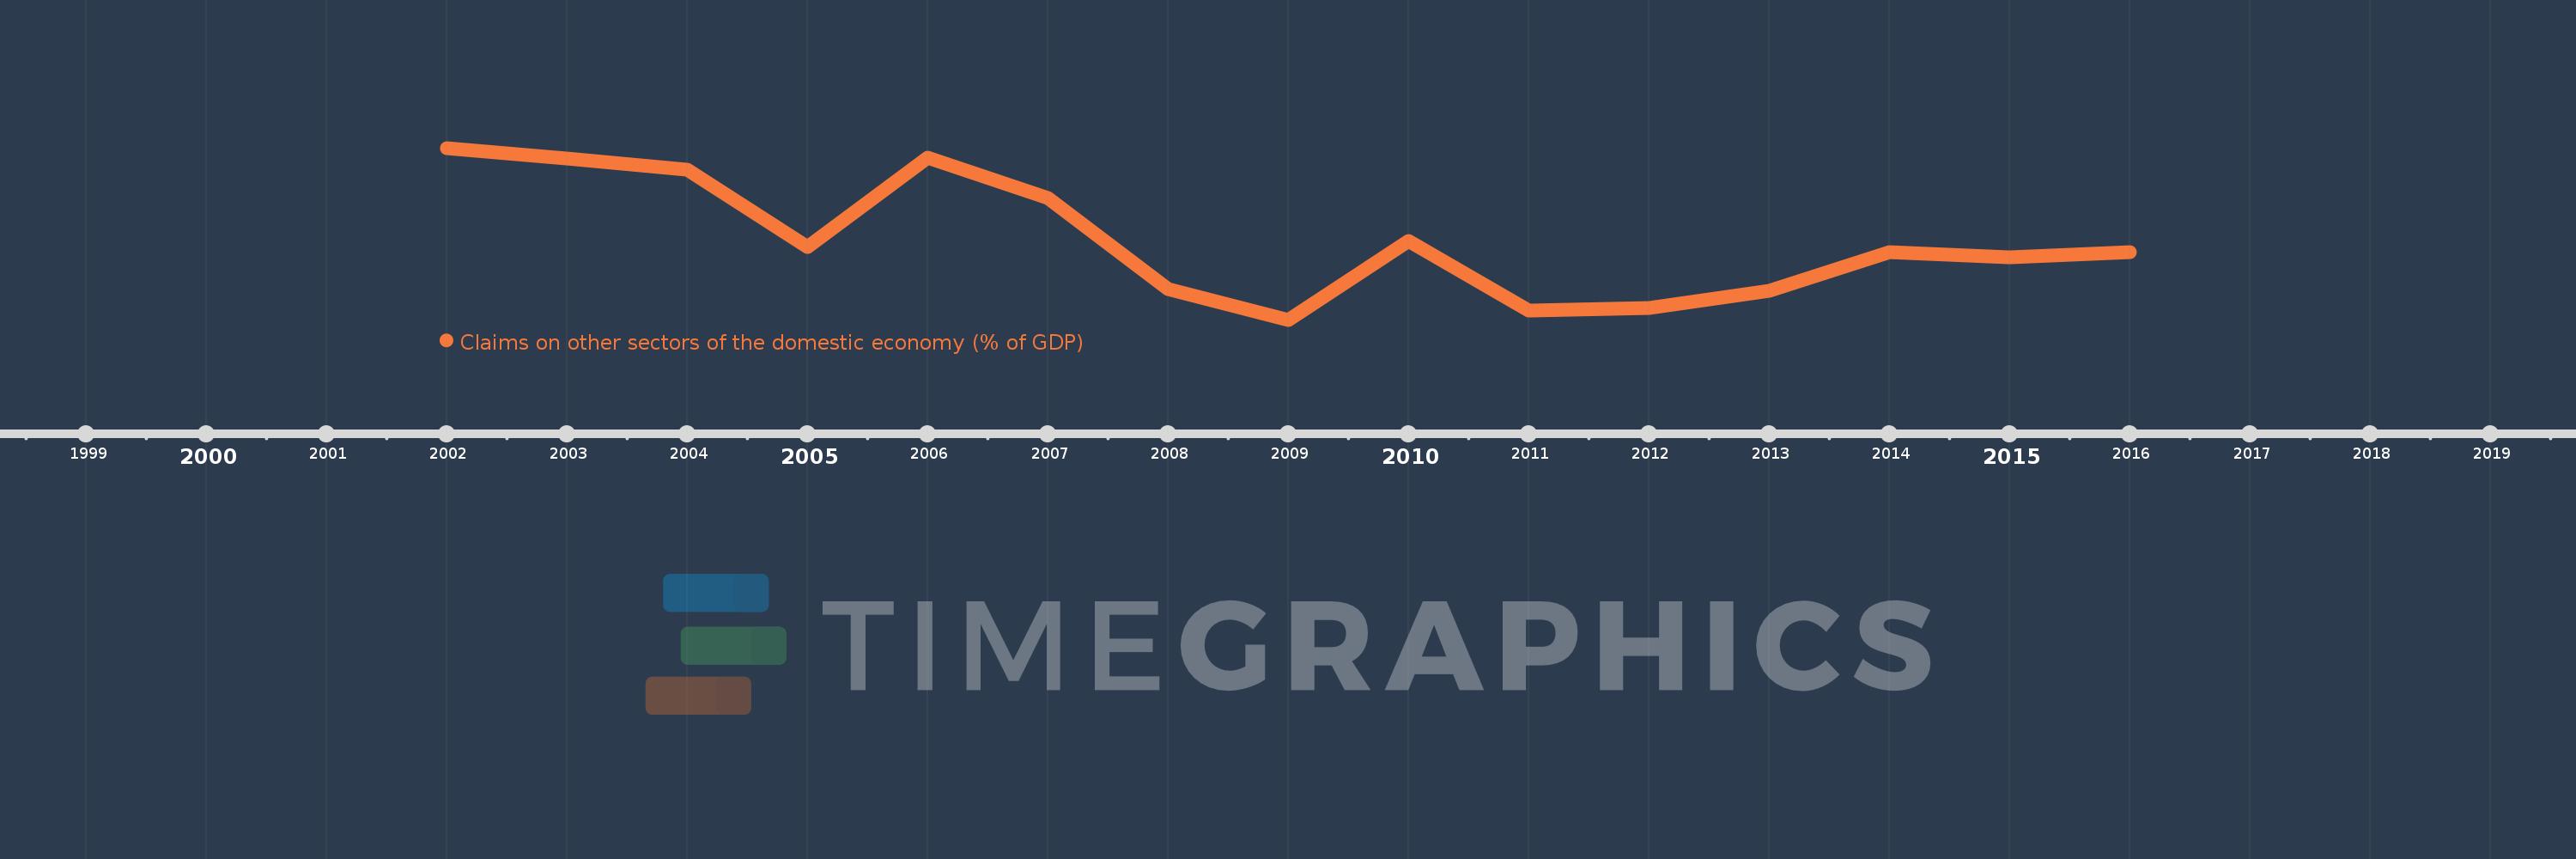
Claims on other sectors of the domestic economy (% of GDP)
2016,2015,2014,2013,2012,2011,2010,2009,2008,2007,2006,2005,2004,2003,2002
Queste statistiche in altri paesi:
Linea del tempo:
Questa scala temporale mostra un grafico dal 2002 anno al 2016 anno. Japan. I dati fino ad 2001 anno non disponibili. Il numero di osservazioni attuali secondo i date: 15.
La fonte (nome):
Indicatori dello sviluppo mondiale
La fonte (organizzazione):
International Monetary Fund, International Financial Statistics and data files, and World Bank and OECD GDP estimates.
Categorie:
Financial Sector
sono stati aggiornati
23 apr 2017 anni
Indicatori delle variazioni dei valori per anni
Minima:
212.277
1 gen 2009 anni
Massimo:
231.213
1 gen 2002 anni
Alla data di osservazione
Valore
Variazione assoluta
La variazione rispetto al valore precedente
1 gen 2002 anni
231.213
+231.213
0.0%
1 gen 2003 anni
230.092
-1.121
-0.48%
1 gen 2004 anni
228.786
-1.306
-0.57%
1 gen 2005 anni
220.322
-8.464
-3.7%
1 gen 2006 anni
230.127
+9.805
4.45%
1 gen 2007 anni
225.684
-4.443
-1.93%
1 gen 2008 anni
215.672
-10.012
-4.44%
1 gen 2009 anni
212.277
-3.395
-1.57%
1 gen 2010 anni
220.913
+8.636
4.07%
1 gen 2011 anni
213.245
-7.668
-3.47%
1 gen 2012 anni
213.541
+0.295
0.14%
1 gen 2013 anni
215.5
+1.96
0.92%
1 gen 2014 anni
219.712
+4.211
1.95%
1 gen 2015 anni
219.14
-0.572
-0.26%
1 gen 2016 anni
219.753
+0.613
0.28%
Classificazione dei paesi secondo i statistiche attuali per anni


Commenti: