29
/it/
it
AIzaSyAYiBZKx7MnpbEhh9jyipgxe19OcubqV5w
April 1, 2024
253937
Suriname
SUR
true
2
1
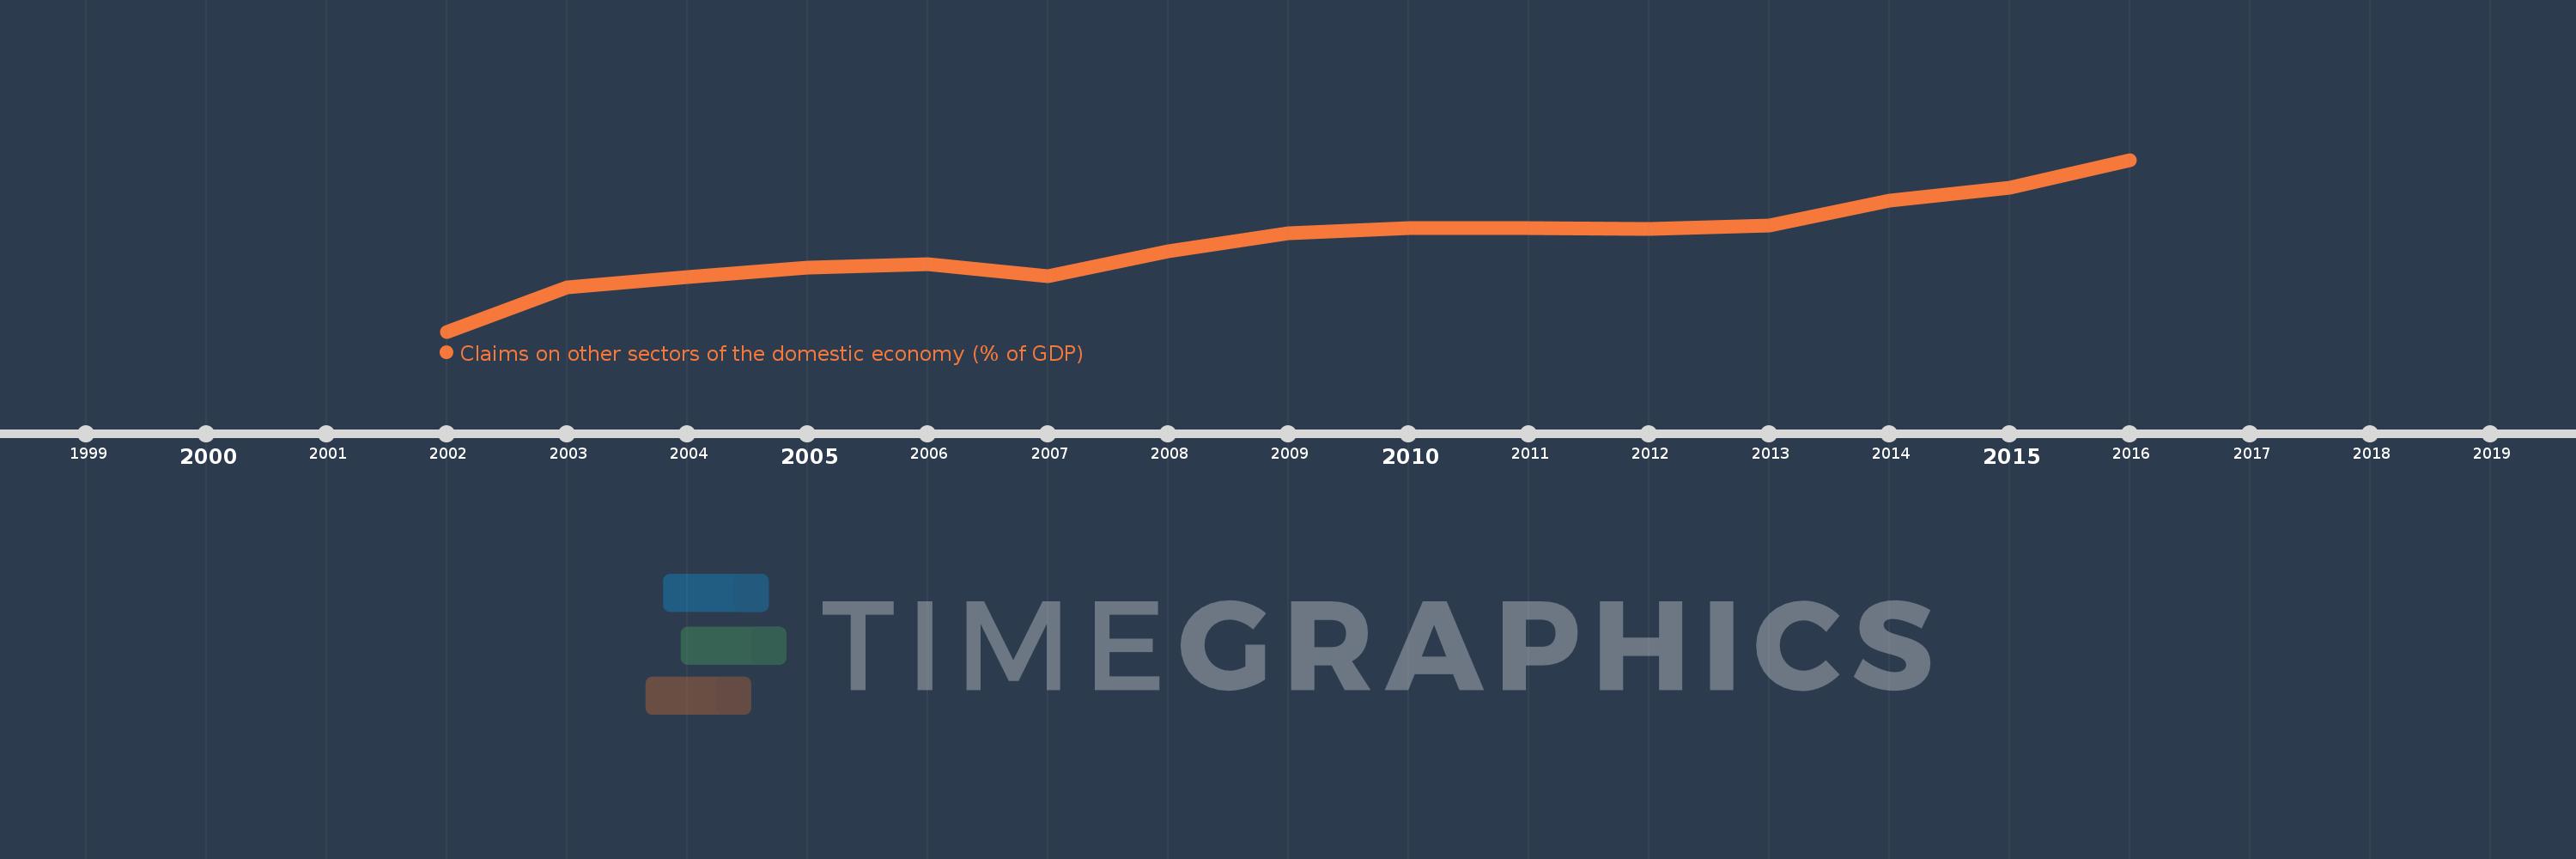
Claims on other sectors of the domestic economy (% of GDP)
2016,2015,2014,2013,2012,2011,2010,2009,2008,2007,2006,2005,2004,2003,2002
Queste statistiche in altri paesi:
Linea del tempo:
Questa scala temporale mostra un grafico dal 2002 anno al 2016 anno. Suriname. I dati fino ad 2001 anno non disponibili. Il numero di osservazioni attuali secondo i date: 15.
La fonte (nome):
Indicatori dello sviluppo mondiale
La fonte (organizzazione):
International Monetary Fund, International Financial Statistics and data files, and World Bank and OECD GDP estimates.
Categorie:
Financial Sector
sono stati aggiornati
23 apr 2017 anni
Indicatori delle variazioni dei valori per anni
Minima:
9.784
1 gen 2002 anni
Massimo:
35.577
1 gen 2016 anni
Alla data di osservazione
Valore
Variazione assoluta
La variazione rispetto al valore precedente
1 gen 2002 anni
9.784
+9.784
0.0%
1 gen 2003 anni
16.398
+6.613
67.59%
1 gen 2004 anni
17.922
+1.524
9.3%
1 gen 2005 anni
19.404
+1.482
8.27%
1 gen 2006 anni
19.924
+0.52
2.68%
1 gen 2007 anni
18.107
-1.817
-9.12%
1 gen 2008 anni
21.854
+3.747
20.69%
1 gen 2009 anni
24.602
+2.748
12.57%
1 gen 2010 anni
25.27
+0.669
2.72%
1 gen 2011 anni
25.318
+0.047
0.19%
1 gen 2012 anni
25.231
-0.087
-0.34%
1 gen 2013 anni
25.659
+0.428
1.7%
1 gen 2014 anni
29.424
+3.764
14.67%
1 gen 2015 anni
31.43
+2.006
6.82%
1 gen 2016 anni
35.577
+4.147
13.19%
Classificazione dei paesi secondo i statistiche attuali per anni


Commenti: