29
/fr/
fr
AIzaSyAYiBZKx7MnpbEhh9jyipgxe19OcubqV5w
April 1, 2024
253937
Suriname
SUR
true
2
1
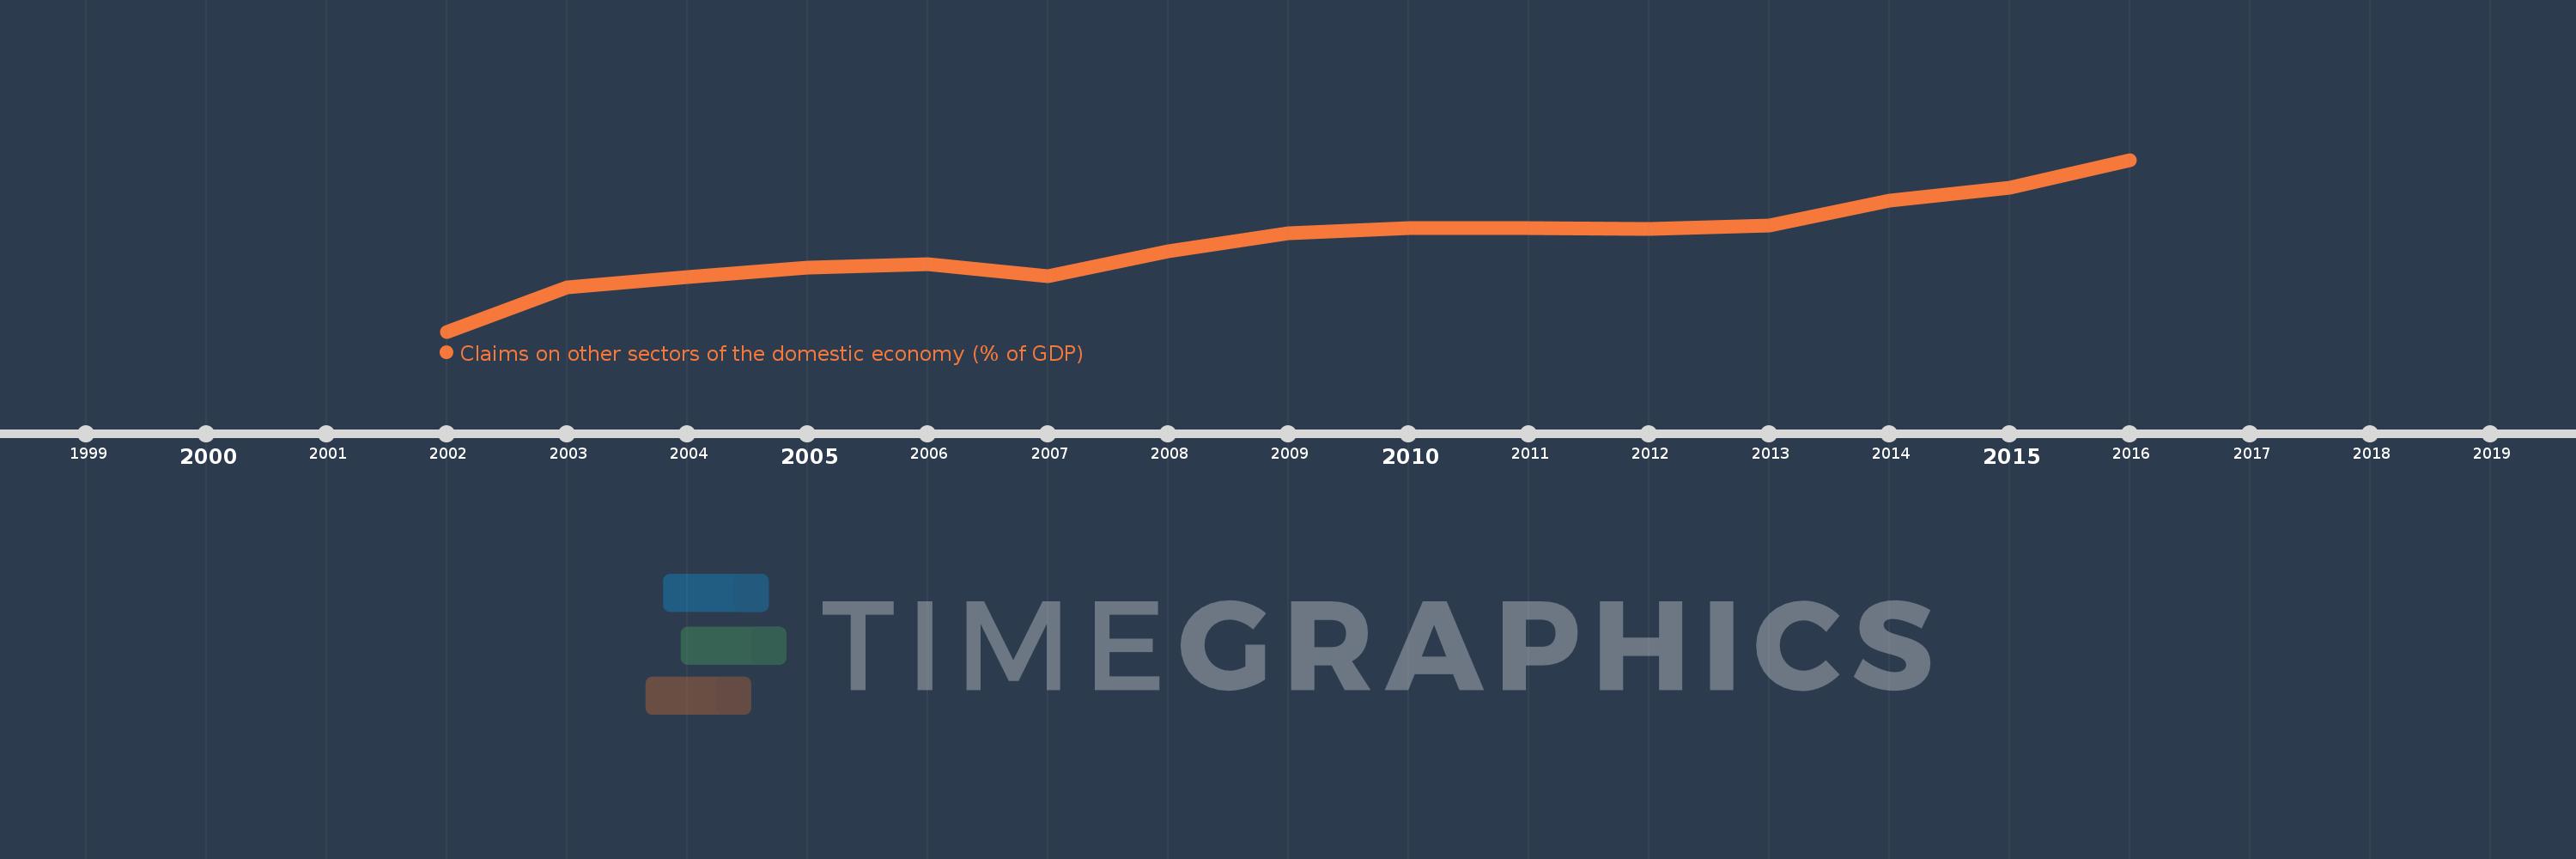
Claims on other sectors of the domestic economy (% of GDP)
2016,2015,2014,2013,2012,2011,2010,2009,2008,2007,2006,2005,2004,2003,2002
Cette statistique dans les autres pays:
La ligne de temps
Cette échelle de temps montre un graphique de 2002 année à 2016 année Suriname. Les données jusqu'à 2001 année ne sont pas présentés. Quantité d'observations actuelles selon dates: 15.
Source (désignation):
Les indicateurs du développement mondiale
Source (organisation):
International Monetary Fund, International Financial Statistics and data files, and World Bank and OECD GDP estimates.
Catégories:
Financial Sector
Dernière mise à jour
23 avr. 2017
Les indicateurs de changement de valeurs selon les années
Minimum:
9.784
1 janv. 2002
Maximum:
35.577
1 janv. 2016
Pour la date d''observation
Valeur
Changement absolu
Le changement par rapport à la valeur précédente
1 janv. 2002
9.784
+9.784
0.0%
1 janv. 2003
16.398
+6.613
67.59%
1 janv. 2004
17.922
+1.524
9.3%
1 janv. 2005
19.404
+1.482
8.27%
1 janv. 2006
19.924
+0.52
2.68%
1 janv. 2007
18.107
-1.817
-9.12%
1 janv. 2008
21.854
+3.747
20.69%
1 janv. 2009
24.602
+2.748
12.57%
1 janv. 2010
25.27
+0.669
2.72%
1 janv. 2011
25.318
+0.047
0.19%
1 janv. 2012
25.231
-0.087
-0.34%
1 janv. 2013
25.659
+0.428
1.7%
1 janv. 2014
29.424
+3.764
14.67%
1 janv. 2015
31.43
+2.006
6.82%
1 janv. 2016
35.577
+4.147
13.19%
Classement des pays selon les statistiques actuelles par années


Commentaires: