29
/fr/
fr
AIzaSyAYiBZKx7MnpbEhh9jyipgxe19OcubqV5w
April 1, 2024
241378
Slovak Republic
SVK
true
2
1
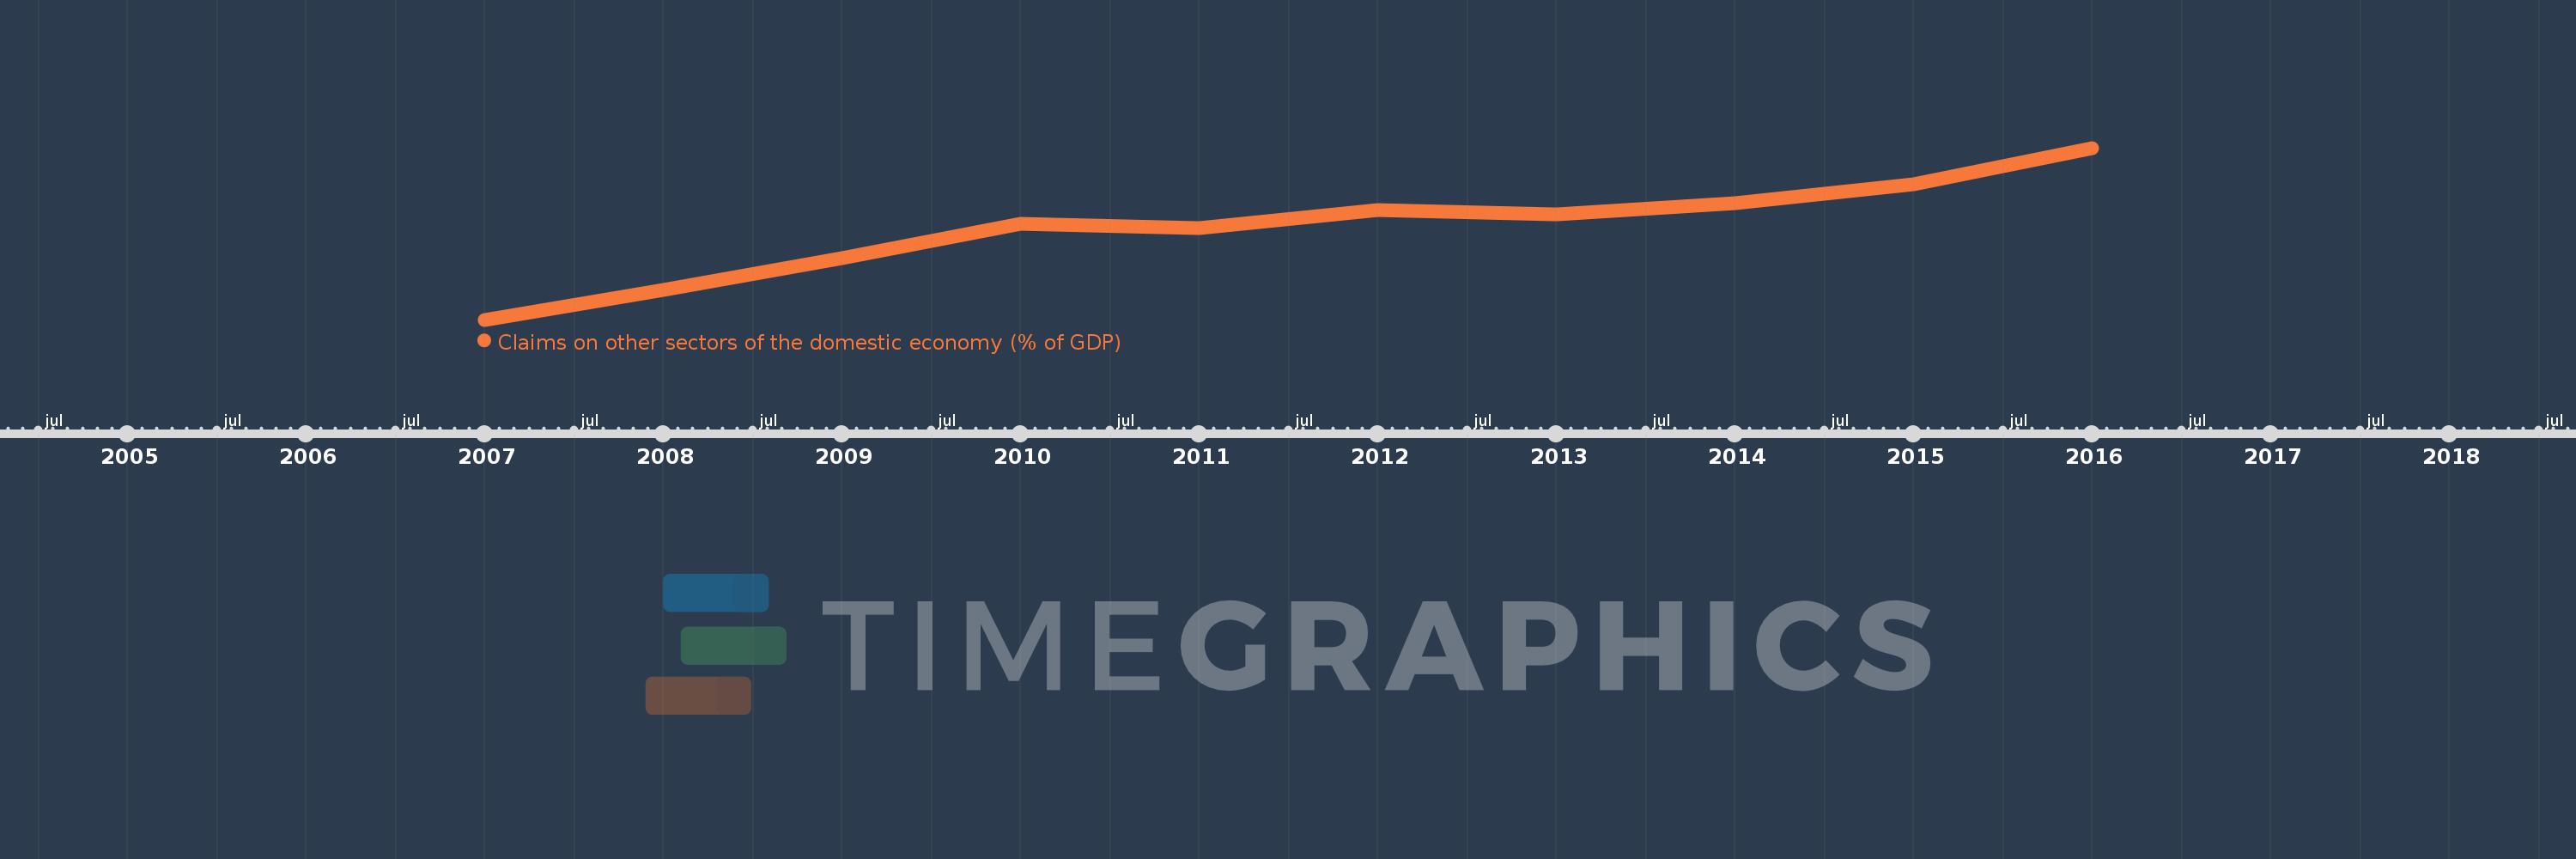
Claims on other sectors of the domestic economy (% of GDP)
2016,2015,2014,2013,2012,2011,2010,2009,2008,2007
Cette statistique dans les autres pays:
La ligne de temps
Cette échelle de temps montre un graphique de 2007 année à 2016 année Slovak Republic. Les données jusqu'à 2006 année ne sont pas présentés. Quantité d'observations actuelles selon dates: 10.
Source (désignation):
Les indicateurs du développement mondiale
Source (organisation):
International Monetary Fund, International Financial Statistics and data files, and World Bank and OECD GDP estimates.
Catégories:
Financial Sector
Dernière mise à jour
23 avr. 2017
Les indicateurs de changement de valeurs selon les années
Minimum:
40.533
1 janv. 2007
Maximum:
56.651
1 janv. 2016
Pour la date d''observation
Valeur
Changement absolu
Le changement par rapport à la valeur précédente
1 janv. 2007
40.533
+40.533
0.0%
1 janv. 2008
43.363
+2.83
6.98%
1 janv. 2009
46.295
+2.932
6.76%
1 janv. 2010
49.536
+3.241
7.0%
1 janv. 2011
49.092
-0.444
-0.9%
1 janv. 2012
50.812
+1.72
3.5%
1 janv. 2013
50.392
-0.42
-0.83%
1 janv. 2014
51.432
+1.04
2.06%
1 janv. 2015
53.269
+1.837
3.57%
1 janv. 2016
56.651
+3.382
6.35%
Classement des pays selon les statistiques actuelles par années


Commentaires: