29
/fr/
fr
AIzaSyAYiBZKx7MnpbEhh9jyipgxe19OcubqV5w
April 1, 2024
198852
Mongolia
MNG
true
2
1
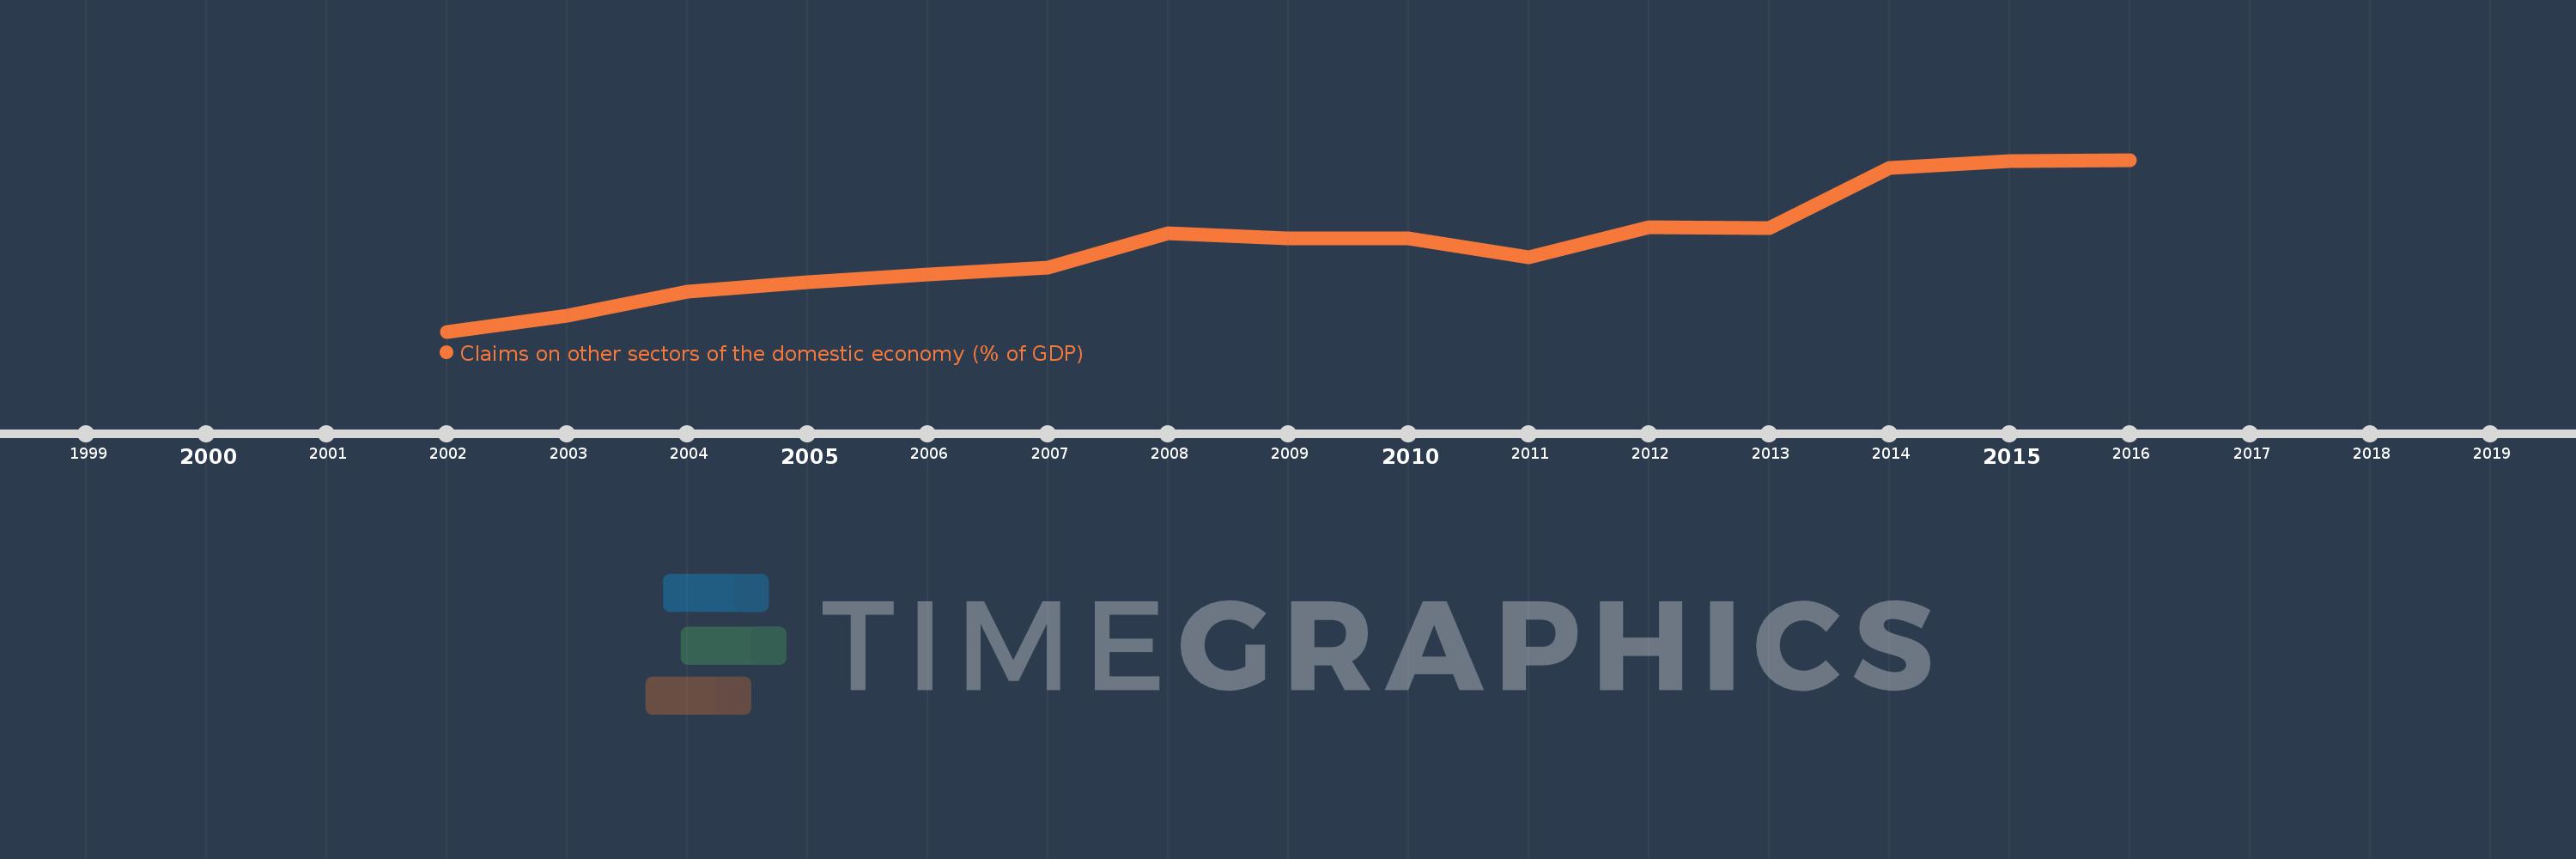
Claims on other sectors of the domestic economy (% of GDP)
2016,2015,2014,2013,2012,2011,2010,2009,2008,2007,2006,2005,2004,2003,2002
Cette statistique dans les autres pays:
La ligne de temps
Cette échelle de temps montre un graphique de 2002 année à 2016 année Mongolia. Les données jusqu'à 2001 année ne sont pas présentés. Quantité d'observations actuelles selon dates: 15.
Source (désignation):
Les indicateurs du développement mondiale
Source (organisation):
International Monetary Fund, International Financial Statistics and data files, and World Bank and OECD GDP estimates.
Catégories:
Financial Sector
Dernière mise à jour
23 avr. 2017
Les indicateurs de changement de valeurs selon les années
Minimum:
9.918
1 janv. 2002
Maximum:
66.511
1 janv. 2016
Pour la date d''observation
Valeur
Changement absolu
Le changement par rapport à la valeur précédente
1 janv. 2002
9.918
+9.918
0.0%
1 janv. 2003
15.213
+5.296
53.39%
1 janv. 2004
23.208
+7.995
52.55%
1 janv. 2005
26.128
+2.92
12.58%
1 janv. 2006
28.691
+2.562
9.81%
1 janv. 2007
31.071
+2.38
8.3%
1 janv. 2008
42.187
+11.116
35.78%
1 janv. 2009
40.494
-1.693
-4.01%
1 janv. 2010
40.681
+0.188
0.46%
1 janv. 2011
34.477
-6.204
-15.25%
1 janv. 2012
44.357
+9.88
28.66%
1 janv. 2013
44.028
-0.33
-0.74%
1 janv. 2014
63.749
+19.721
44.79%
1 janv. 2015
66.058
+2.309
3.62%
1 janv. 2016
66.511
+0.453
0.69%
Classement des pays selon les statistiques actuelles par années


Commentaires: