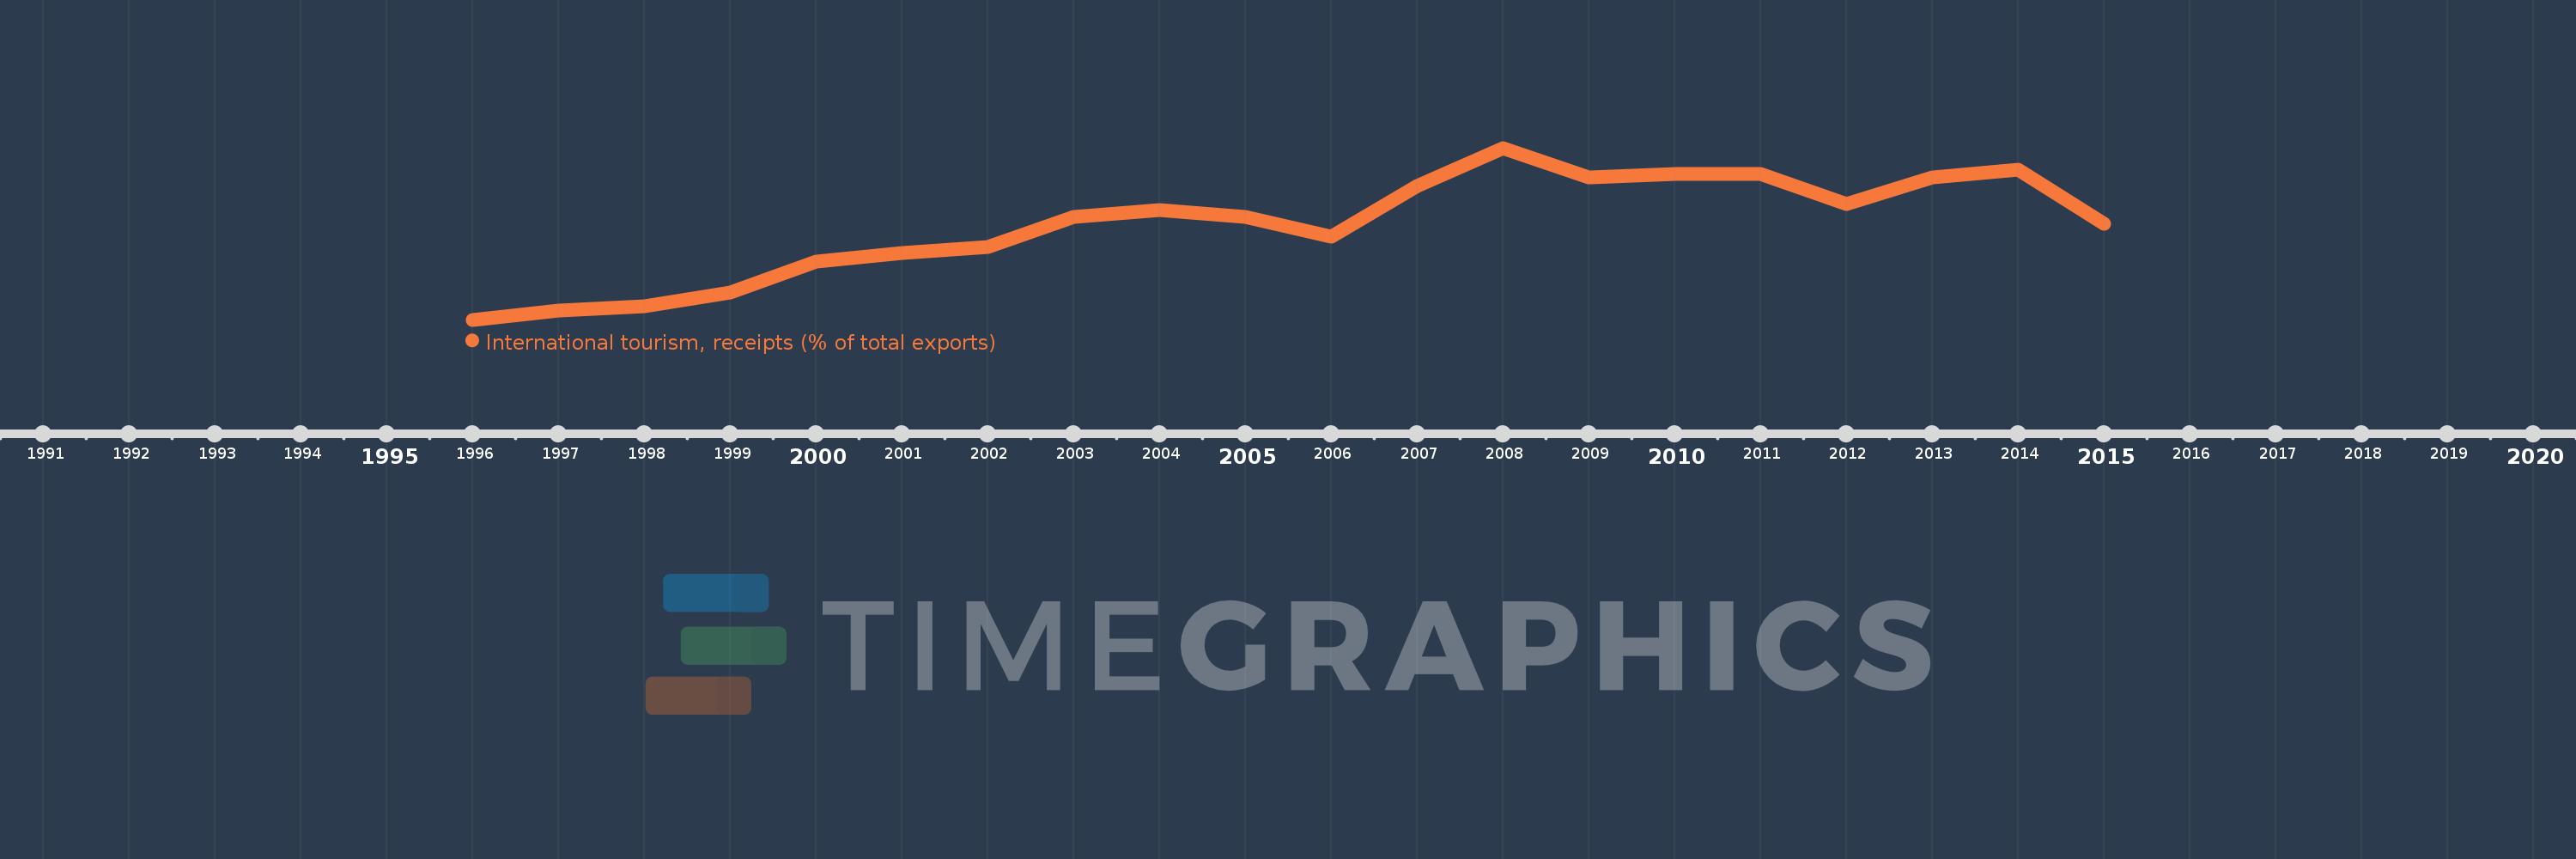
Questa scala temporale mostra un grafico dal 1996 anno al 2015 anno. Cabo Verde. I dati fino ad 1995 anno non disponibili. Il numero di osservazioni attuali secondo i date: 20.
La fonte (nome):
Indicatori dello sviluppo mondiale
La fonte (organizzazione):
World Tourism Organization, Yearbook of Tourism Statistics, Compendium of Tourism Statistics and data files, and IMF and World Bank exports estimates.
Categorie:
Private Sector, Trade
sono stati aggiornati
23 apr 2017 anni
Indicatori delle variazioni dei valori per anni
In media:
52.075
Minima:
34.738
1 gen 1996 anni
Massimo:
66.251
1 gen 2008 anni
Alla data di osservazione
Valore
Variazione assoluta
La variazione rispetto al valore precedente
1 gen 1996 anni
34.738
+34.738
0.0%
1 gen 1997 anni
36.491
+1.753
5.05%
1 gen 1998 anni
37.162
+0.672
1.84%
1 gen 1999 anni
39.804
+2.642
7.11%
1 gen 2000 anni
45.478
+5.674
14.25%
1 gen 2001 anni
46.96
+1.482
3.26%
1 gen 2002 anni
48.081
+1.121
2.39%
1 gen 2003 anni
53.561
+5.48
11.4%
1 gen 2004 anni
54.876
+1.315
2.46%
1 gen 2005 anni
53.605
-1.271
-2.32%
1 gen 2006 anni
50.031
-3.575
-6.67%
1 gen 2007 anni
59.285
+9.254
18.5%
1 gen 2008 anni
66.251
+6.966
11.75%
1 gen 2009 anni
60.803
-5.448
-8.22%
1 gen 2010 anni
61.512
+0.709
1.17%
1 gen 2011 anni
61.451
-0.061
-0.1%
1 gen 2012 anni
56.02
-5.431
-8.84%
1 gen 2013 anni
60.848
+4.828
8.62%
1 gen 2014 anni
62.27
+1.422
2.34%
1 gen 2015 anni
52.276
-9.994
-16.05%
Classificazione dei paesi secondo i statistiche attuali per anni