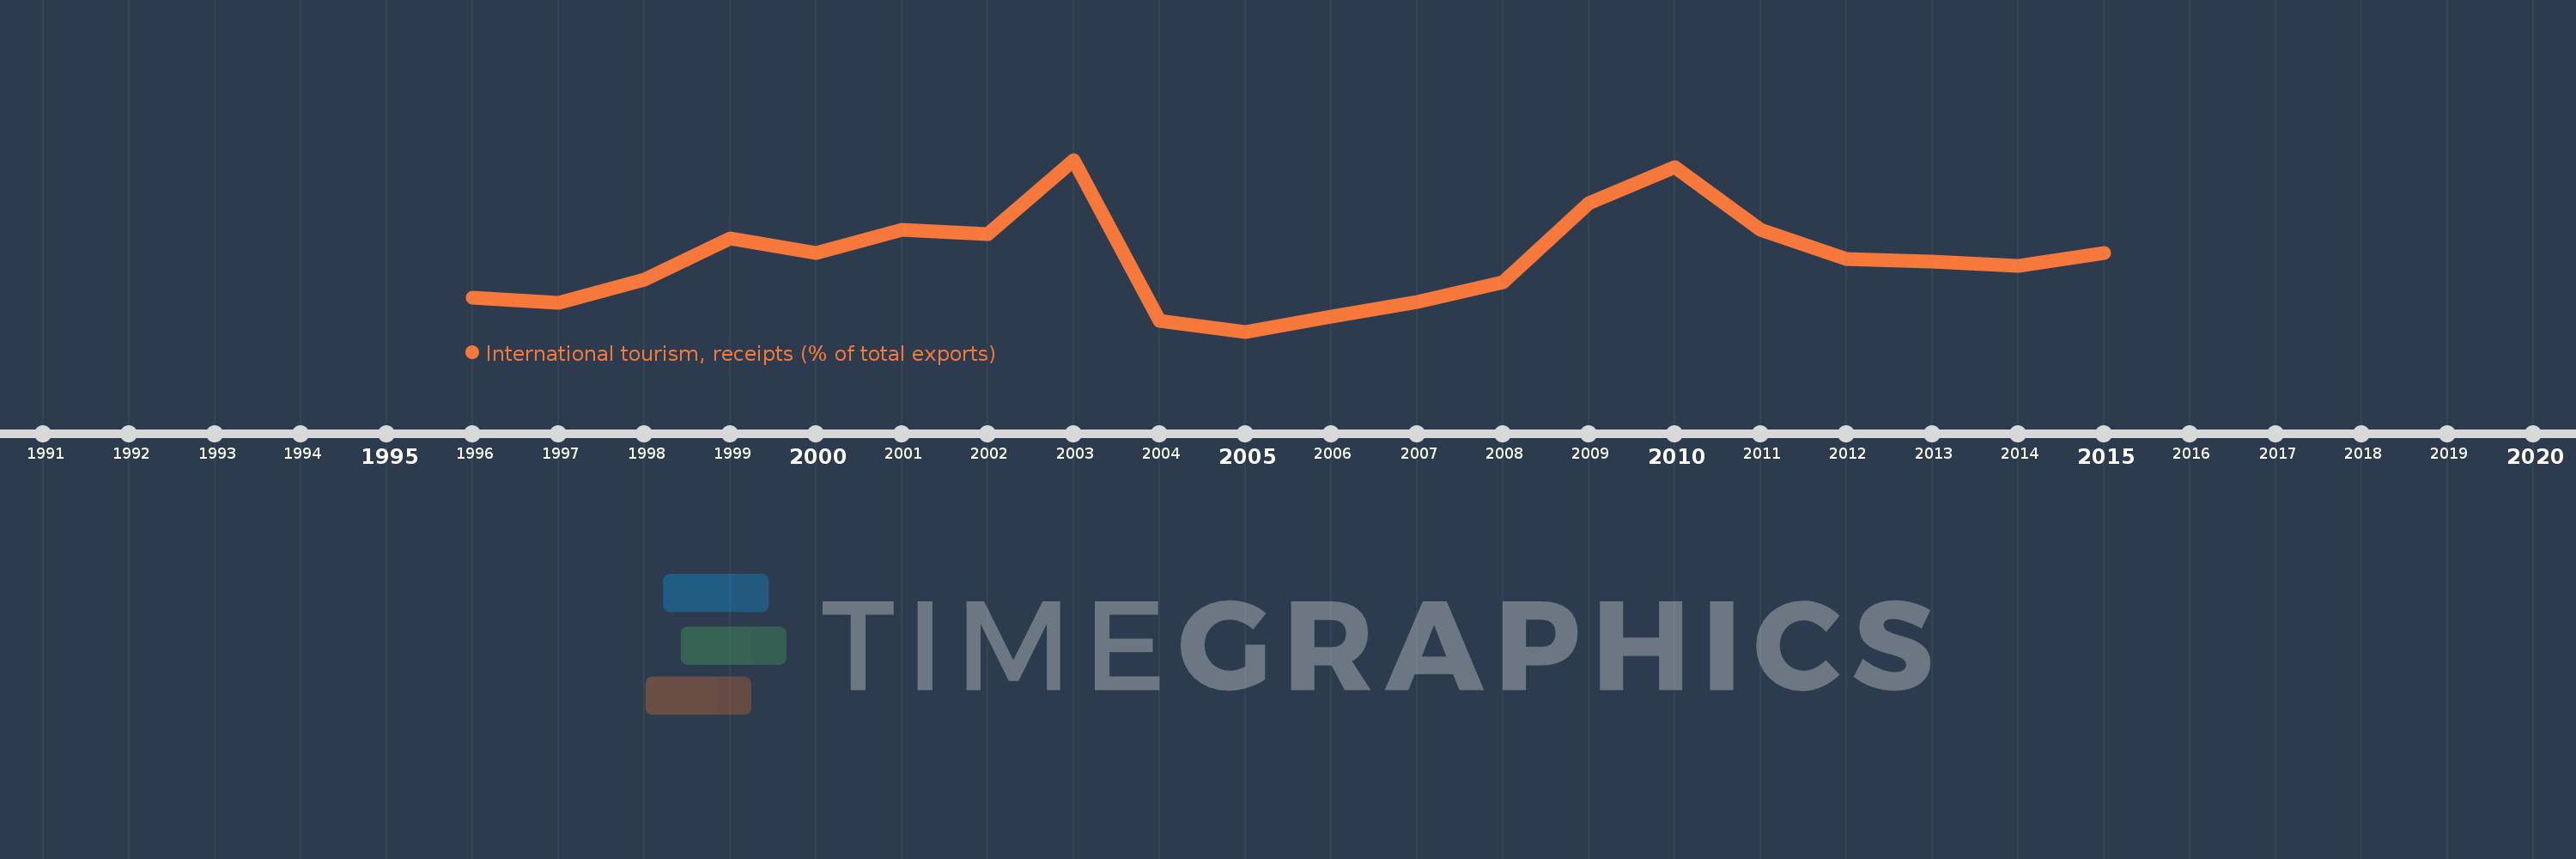
Questa scala temporale mostra un grafico dal 1996 anno al 2015 anno. Nigeria. I dati fino ad 1995 anno non disponibili. Il numero di osservazioni attuali secondo i date: 20.
La fonte (nome):
Indicatori dello sviluppo mondiale
La fonte (organizzazione):
World Tourism Organization, Yearbook of Tourism Statistics, Compendium of Tourism Statistics and data files, and IMF and World Bank exports estimates.
Categorie:
Private Sector, Trade
sono stati aggiornati
23 apr 2017 anni
Indicatori delle variazioni dei valori per anni
In media:
0.668
Minima:
0.129
1 gen 2005 anni
Massimo:
1.411
1 gen 2003 anni
Alla data di osservazione
Valore
Variazione assoluta
La variazione rispetto al valore precedente
1 gen 1996 anni
0.381
+0.381
0.0%
1 gen 1997 anni
0.344
-0.037
-9.61%
1 gen 1998 anni
0.519
+0.175
50.76%
1 gen 1999 anni
0.822
+0.303
58.38%
1 gen 2000 anni
0.714
-0.107
-13.07%
1 gen 2001 anni
0.887
+0.173
24.17%
1 gen 2002 anni
0.855
-0.032
-3.61%
1 gen 2003 anni
1.411
+0.556
65.05%
1 gen 2004 anni
0.211
-1.2
-85.03%
1 gen 2005 anni
0.129
-0.083
-39.14%
1 gen 2006 anni
0.244
+0.115
89.64%
1 gen 2007 anni
0.353
+0.109
44.67%
1 gen 2008 anni
0.499
+0.147
41.53%
1 gen 2009 anni
1.089
+0.59
118.13%
1 gen 2010 anni
1.355
+0.265
24.37%
1 gen 2011 anni
0.89
-0.465
-34.31%
1 gen 2012 anni
0.672
-0.218
-24.53%
1 gen 2013 anni
0.649
-0.023
-3.43%
1 gen 2014 anni
0.62
-0.029
-4.47%
1 gen 2015 anni
0.716
+0.097
15.61%
Classificazione dei paesi secondo i statistiche attuali per anni