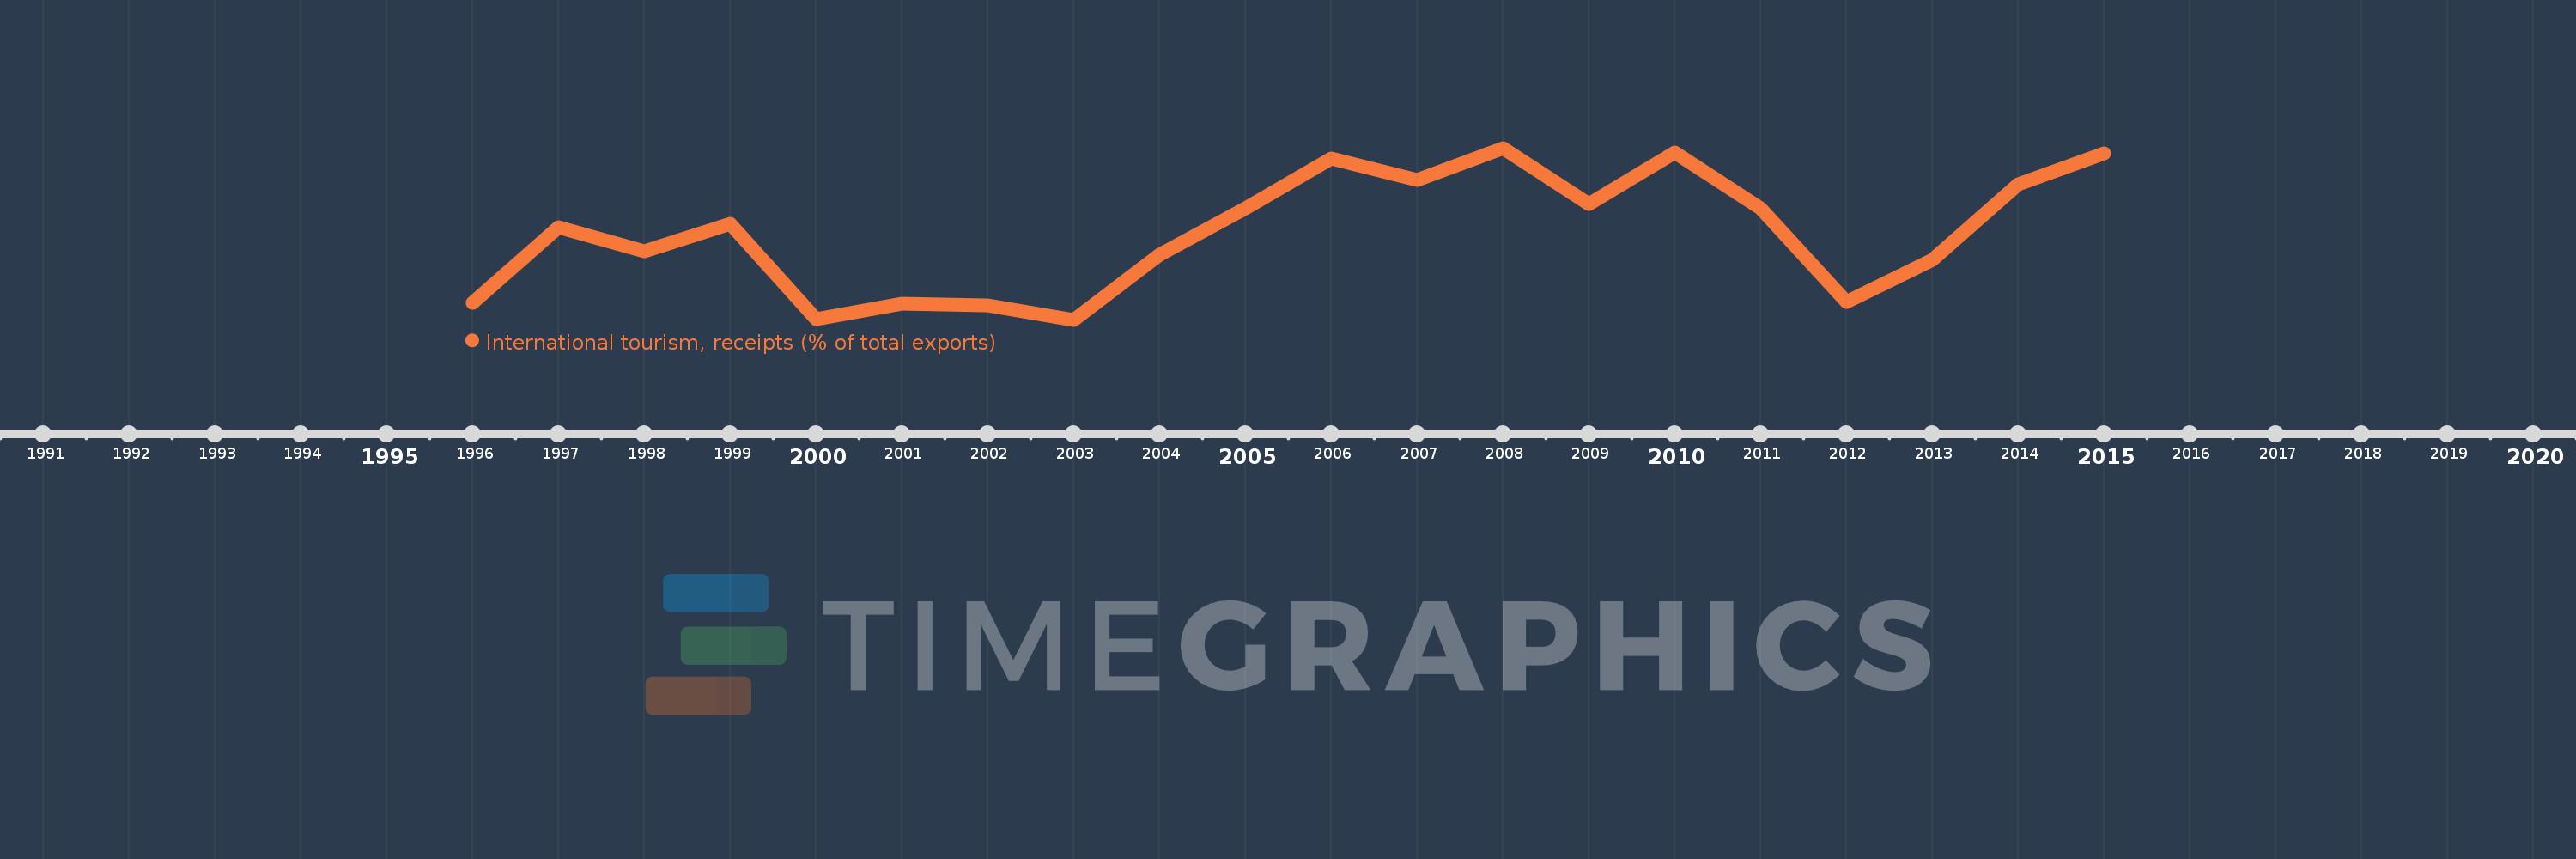
Questa scala temporale mostra un grafico dal 1996 anno al 2015 anno. Belize. I dati fino ad 1995 anno non disponibili. Il numero di osservazioni attuali secondo i date: 20.
La fonte (nome):
Indicatori dello sviluppo mondiale
La fonte (organizzazione):
World Tourism Organization, Yearbook of Tourism Statistics, Compendium of Tourism Statistics and data files, and IMF and World Bank exports estimates.
Categorie:
Private Sector, Trade
sono stati aggiornati
23 apr 2017 anni
Indicatori delle variazioni dei valori per anni
In media:
30.353
Minima:
25.253
1 gen 2003 anni
Massimo:
35.401
1 gen 2008 anni
Alla data di osservazione
Valore
Variazione assoluta
La variazione rispetto al valore precedente
1 gen 1996 anni
26.231
+26.231
0.0%
1 gen 1997 anni
30.73
+4.499
17.15%
1 gen 1998 anni
29.284
-1.446
-4.71%
1 gen 1999 anni
30.924
+1.64
5.6%
1 gen 2000 anni
25.284
-5.64
-18.24%
1 gen 2001 anni
26.198
+0.914
3.61%
1 gen 2002 anni
26.096
-0.102
-0.39%
1 gen 2003 anni
25.253
-0.843
-3.23%
1 gen 2004 anni
29.084
+3.831
15.17%
1 gen 2005 anni
31.815
+2.731
9.39%
1 gen 2006 anni
34.797
+2.982
9.37%
1 gen 2007 anni
33.507
-1.29
-3.71%
1 gen 2008 anni
35.401
+1.895
5.65%
1 gen 2009 anni
32.081
-3.321
-9.38%
1 gen 2010 anni
35.15
+3.07
9.57%
1 gen 2011 anni
31.823
-3.327
-9.46%
1 gen 2012 anni
26.278
-5.546
-17.43%
1 gen 2013 anni
28.809
+2.531
9.63%
1 gen 2014 anni
33.235
+4.426
15.36%
1 gen 2015 anni
35.088
+1.853
5.58%
Classificazione dei paesi secondo i statistiche attuali per anni