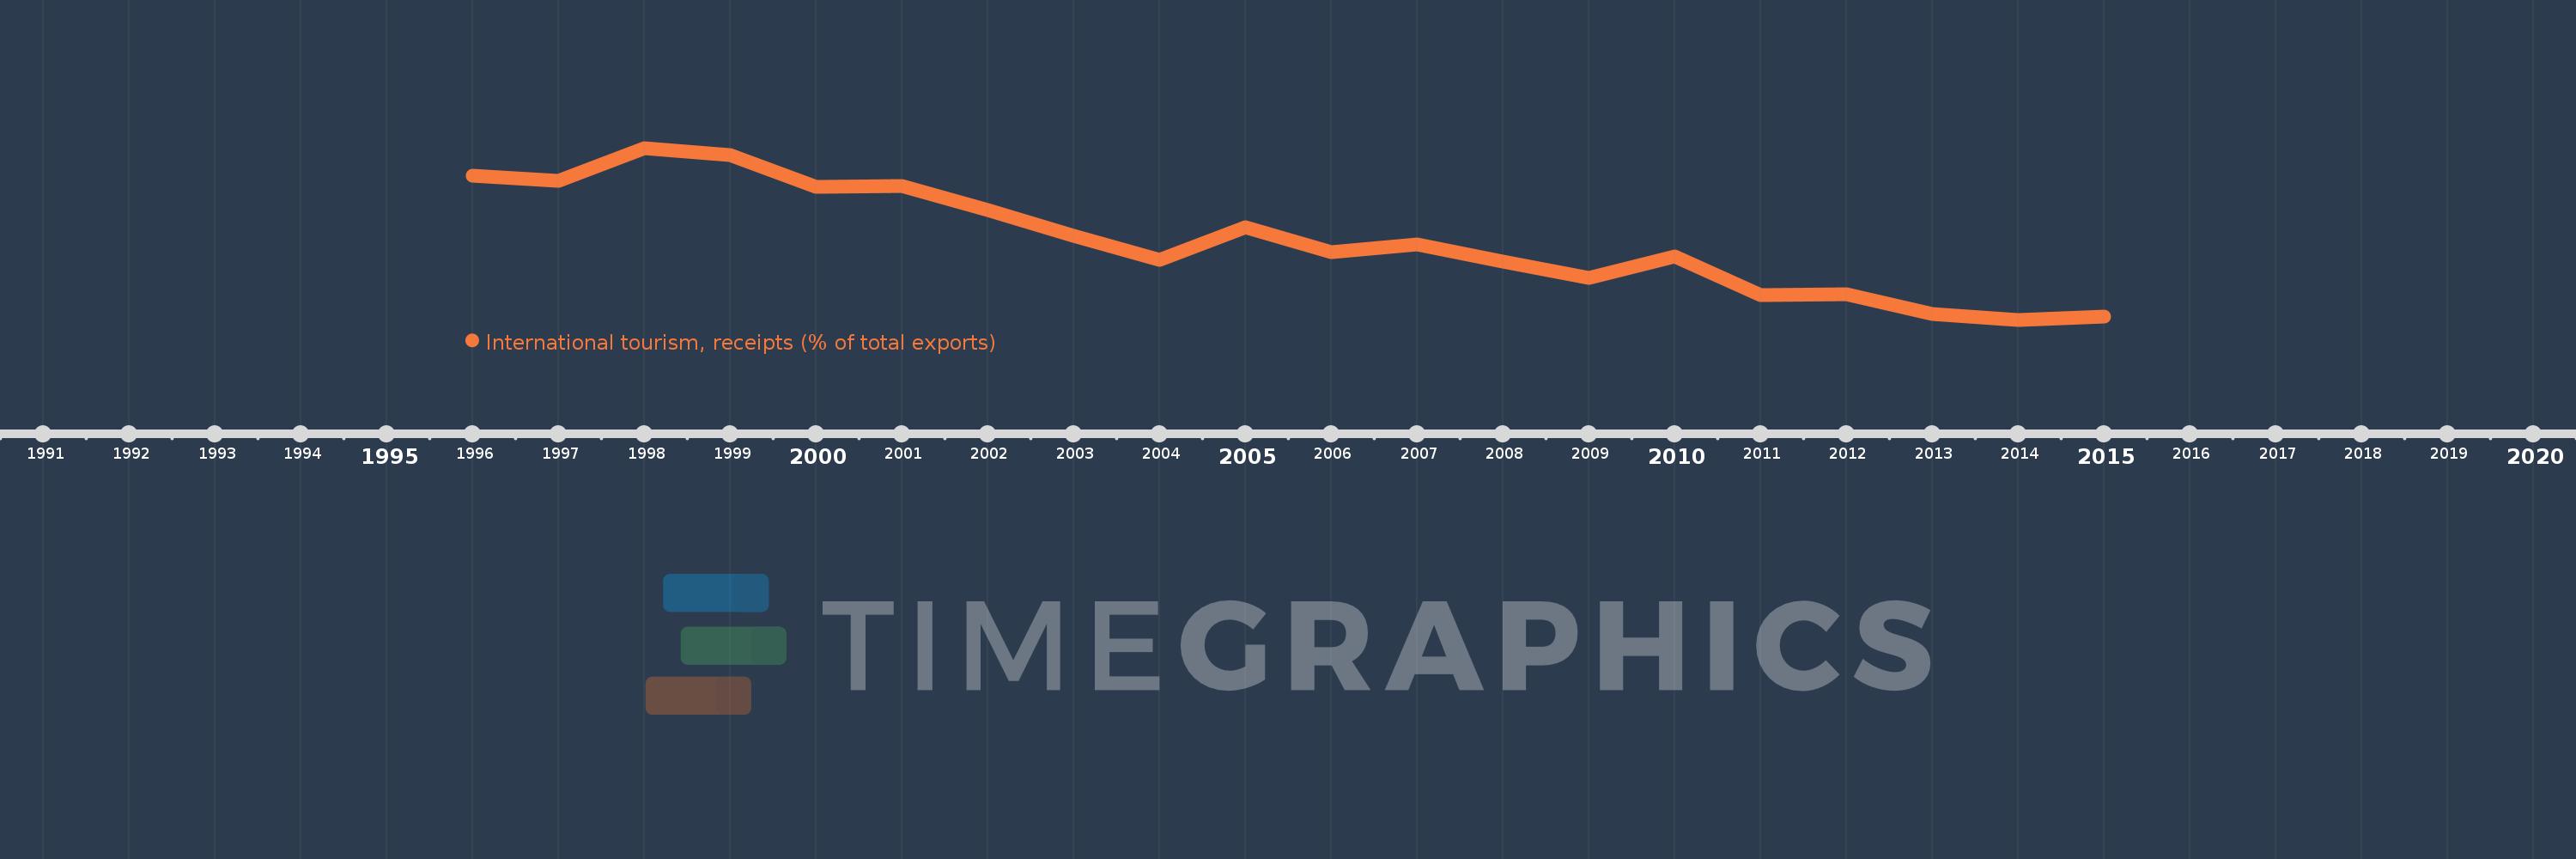
Questa scala temporale mostra un grafico dal 1996 anno al 2015 anno. Pakistan. I dati fino ad 1995 anno non disponibili. Il numero di osservazioni attuali secondo i date: 20.
La fonte (nome):
Indicatori dello sviluppo mondiale
La fonte (organizzazione):
World Tourism Organization, Yearbook of Tourism Statistics, Compendium of Tourism Statistics and data files, and IMF and World Bank exports estimates.
Categorie:
Private Sector, Trade
sono stati aggiornati
23 apr 2017 anni
Indicatori delle variazioni dei valori per anni
In media:
4.551
Minima:
3.122
1 gen 2014 anni
Massimo:
6.195
1 gen 1998 anni
Alla data di osservazione
Valore
Variazione assoluta
La variazione rispetto al valore precedente
1 gen 1996 anni
5.698
+5.698
0.0%
1 gen 1997 anni
5.607
-0.092
-1.61%
1 gen 1998 anni
6.195
+0.588
10.5%
1 gen 1999 anni
6.073
-0.122
-1.97%
1 gen 2000 anni
5.5
-0.573
-9.43%
1 gen 2001 anni
5.512
+0.011
0.21%
1 gen 2002 anni
5.09
-0.421
-7.65%
1 gen 2003 anni
4.622
-0.468
-9.19%
1 gen 2004 anni
4.196
-0.426
-9.22%
1 gen 2005 anni
4.773
+0.577
13.75%
1 gen 2006 anni
4.334
-0.439
-9.2%
1 gen 2007 anni
4.474
+0.14
3.24%
1 gen 2008 anni
4.156
-0.319
-7.12%
1 gen 2009 anni
3.871
-0.285
-6.85%
1 gen 2010 anni
4.258
+0.387
9.99%
1 gen 2011 anni
3.557
-0.7
-16.45%
1 gen 2012 anni
3.585
+0.028
0.79%
1 gen 2013 anni
3.232
-0.353
-9.86%
1 gen 2014 anni
3.122
-0.11
-3.4%
1 gen 2015 anni
3.173
+0.051
1.63%
Classificazione dei paesi secondo i statistiche attuali per anni