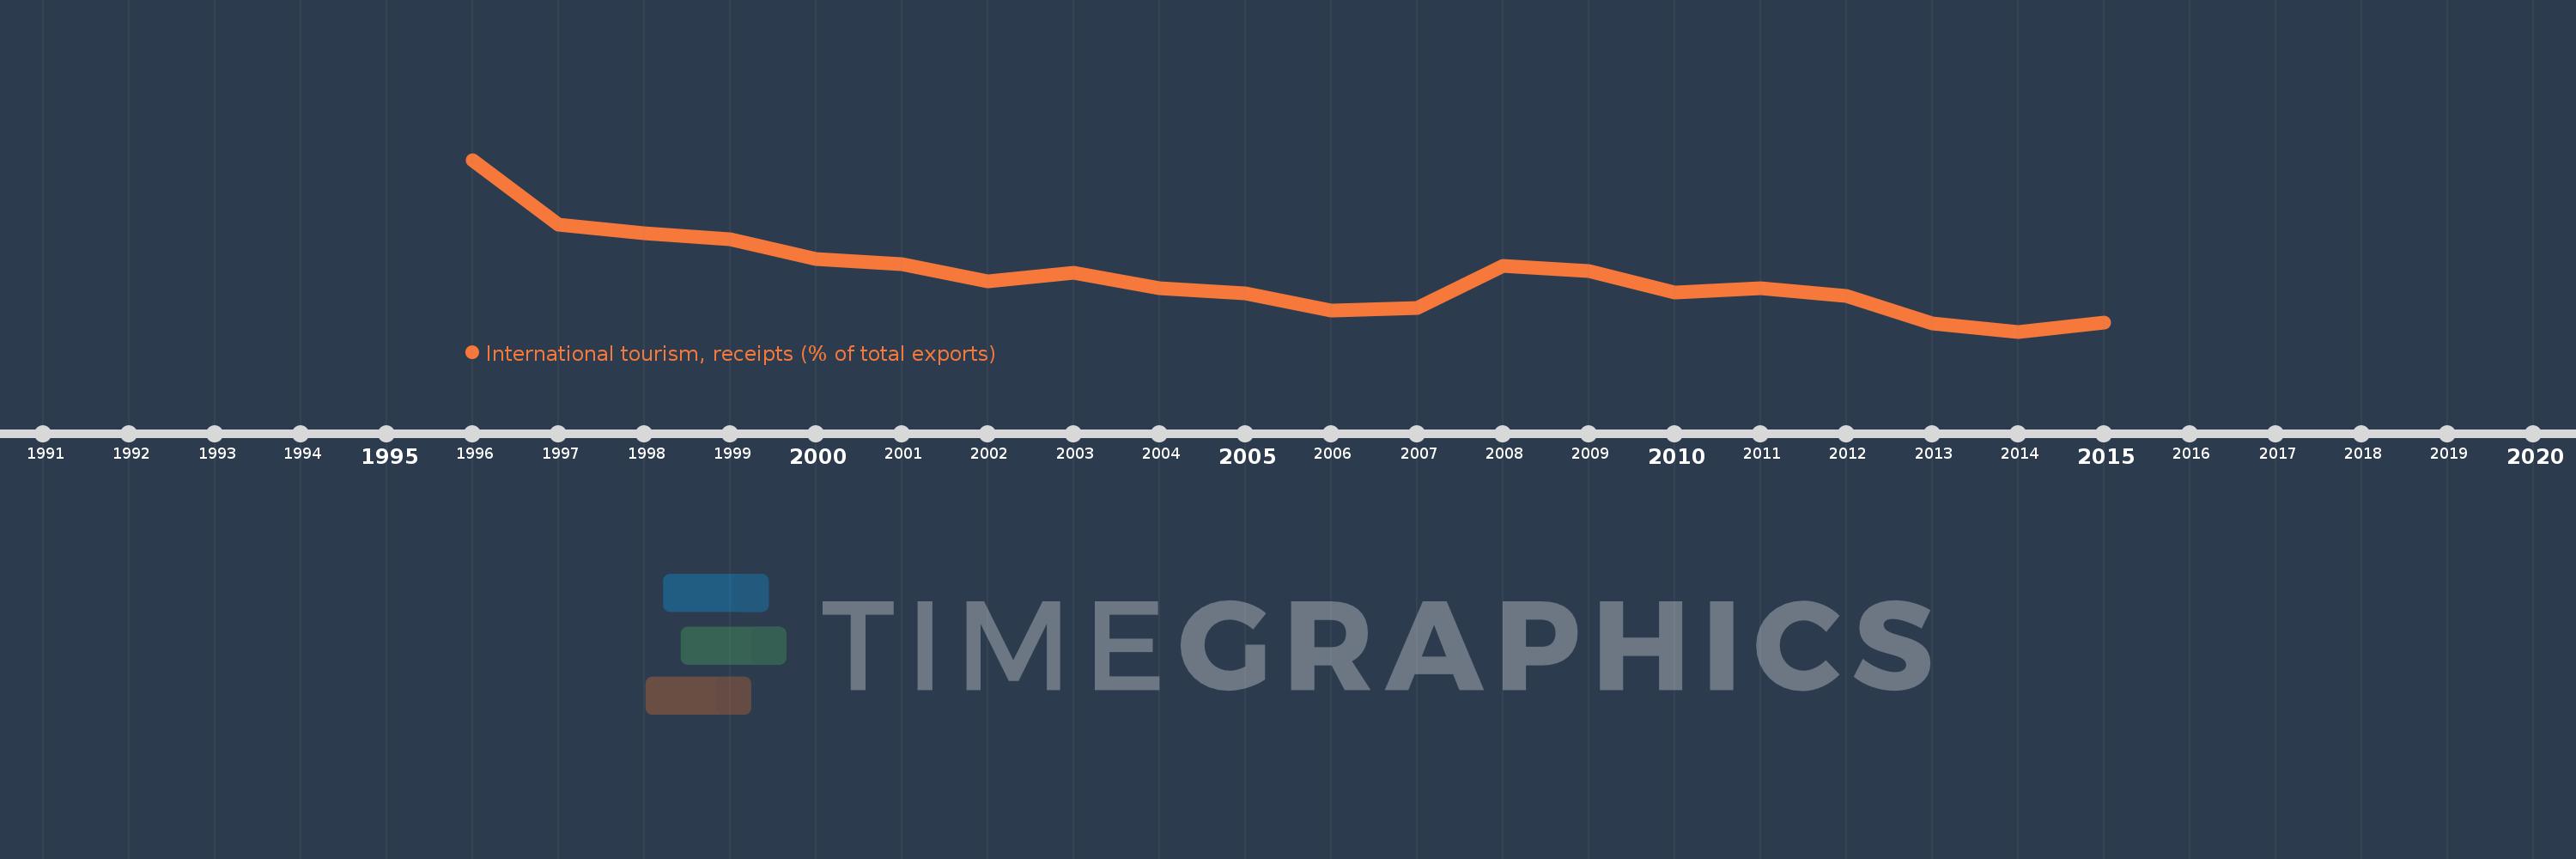
Questa scala temporale mostra un grafico dal 1996 anno al 2015 anno. Seychelles. I dati fino ad 1995 anno non disponibili. Il numero di osservazioni attuali secondo i date: 20.
La fonte (nome):
Indicatori dello sviluppo mondiale
La fonte (organizzazione):
World Tourism Organization, Yearbook of Tourism Statistics, Compendium of Tourism Statistics and data files, and IMF and World Bank exports estimates.
Categorie:
Private Sector, Trade
sono stati aggiornati
23 apr 2017 anni
Indicatori delle variazioni dei valori per anni
In media:
44.246
Minima:
33.244
1 gen 2014 anni
Massimo:
67.43
1 gen 1996 anni
Alla data di osservazione
Valore
Variazione assoluta
La variazione rispetto al valore precedente
1 gen 1996 anni
67.43
+67.43
0.0%
1 gen 1997 anni
54.537
-12.893
-19.12%
1 gen 1998 anni
52.786
-1.751
-3.21%
1 gen 1999 anni
51.578
-1.208
-2.29%
1 gen 2000 anni
47.759
-3.819
-7.4%
1 gen 2001 anni
46.709
-1.05
-2.2%
1 gen 2002 anni
43.282
-3.426
-7.34%
1 gen 2003 anni
44.91
+1.627
3.76%
1 gen 2004 anni
41.827
-3.082
-6.86%
1 gen 2005 anni
40.784
-1.044
-2.5%
1 gen 2006 anni
37.378
-3.405
-8.35%
1 gen 2007 anni
37.984
+0.606
1.62%
1 gen 2008 anni
46.385
+8.401
22.12%
1 gen 2009 anni
45.229
-1.155
-2.49%
1 gen 2010 anni
41.069
-4.161
-9.2%
1 gen 2011 anni
41.867
+0.799
1.94%
1 gen 2012 anni
40.32
-1.547
-3.7%
1 gen 2013 anni
34.799
-5.521
-13.69%
1 gen 2014 anni
33.244
-1.556
-4.47%
1 gen 2015 anni
35.038
+1.795
5.4%
Classificazione dei paesi secondo i statistiche attuali per anni