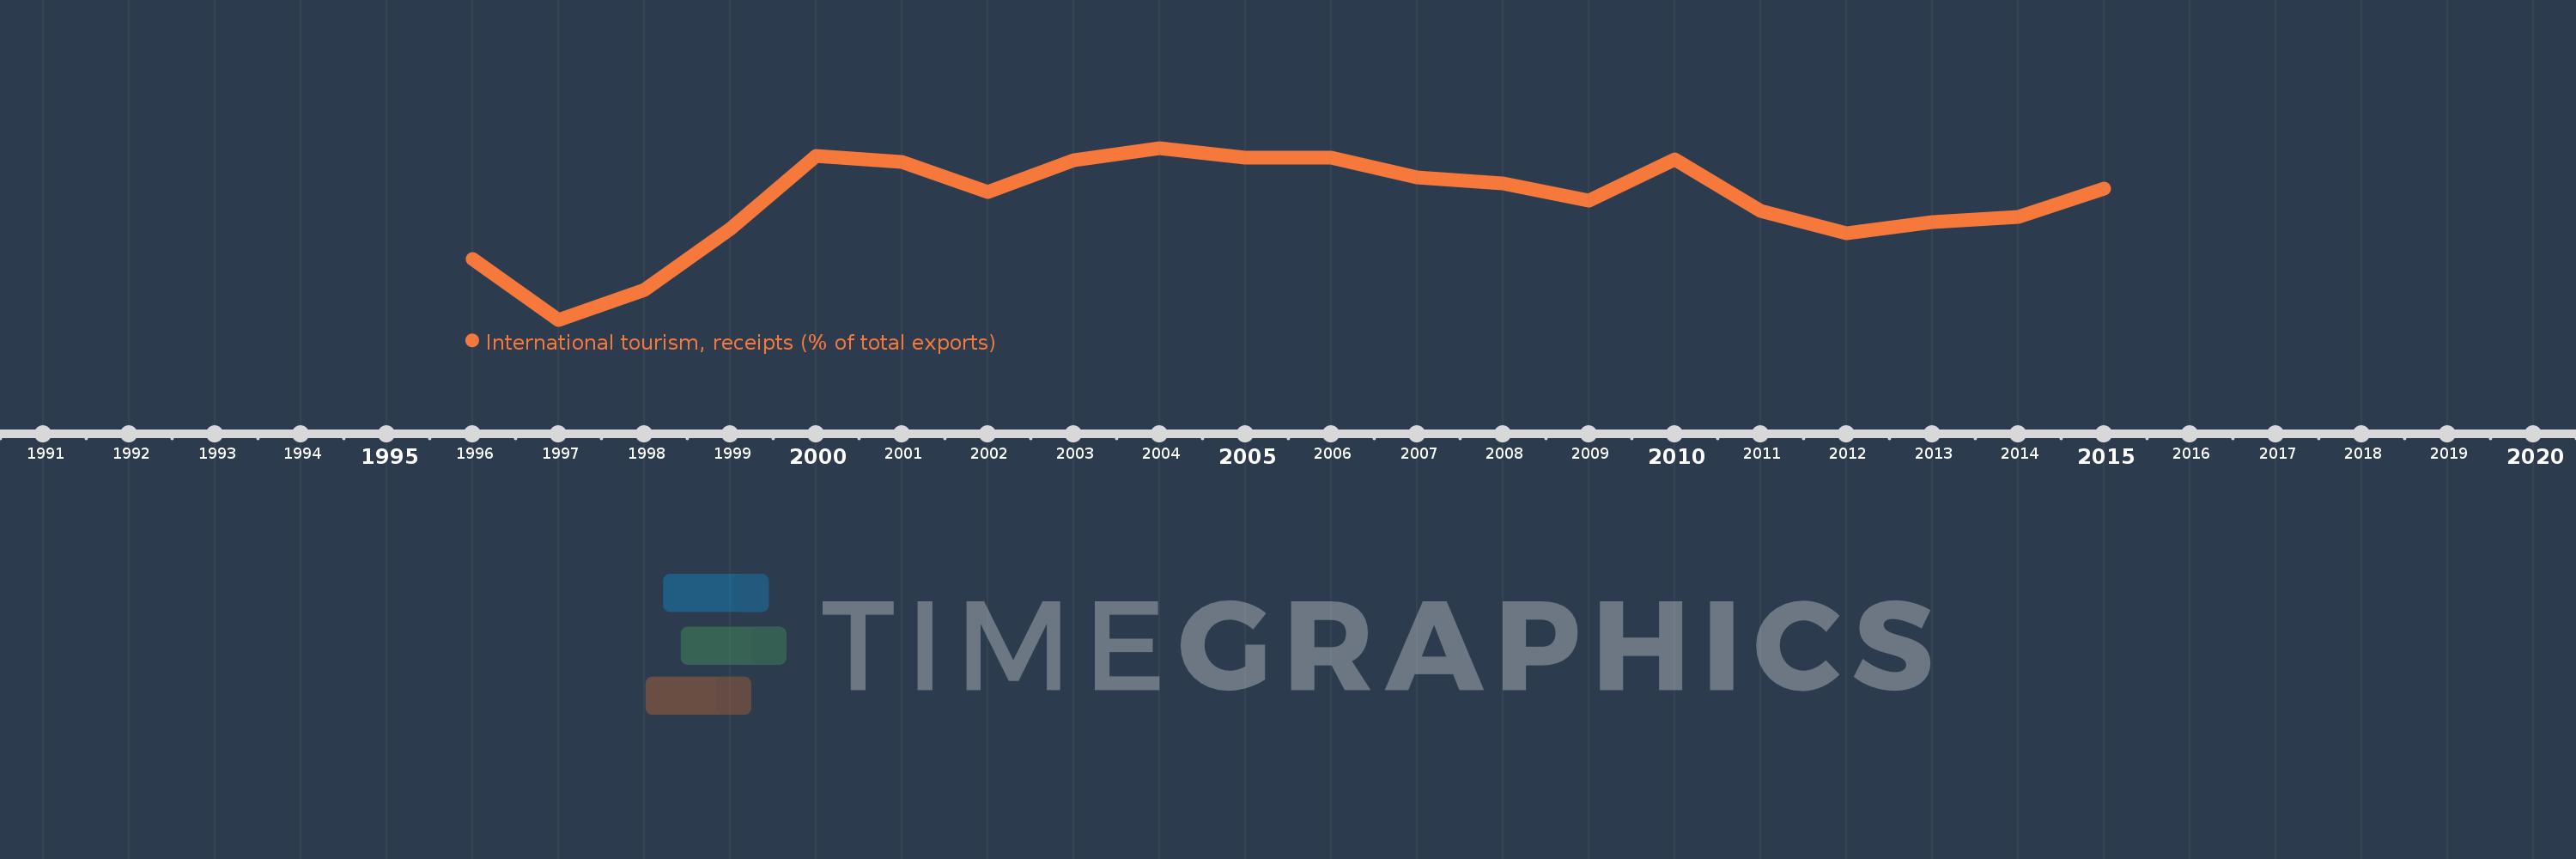
Questa scala temporale mostra un grafico dal 1996 anno al 2015 anno. Brazil. I dati fino ad 1995 anno non disponibili. Il numero di osservazioni attuali secondo i date: 20.
La fonte (nome):
Indicatori dello sviluppo mondiale
La fonte (organizzazione):
World Tourism Organization, Yearbook of Tourism Statistics, Compendium of Tourism Statistics and data files, and IMF and World Bank exports estimates.
Categorie:
Private Sector, Trade
sono stati aggiornati
23 apr 2017 anni
Indicatori delle variazioni dei valori per anni
In media:
2.673
Minima:
1.417
1 gen 1997 anni
Massimo:
3.237
1 gen 2004 anni
Alla data di osservazione
Valore
Variazione assoluta
La variazione rispetto al valore precedente
1 gen 1996 anni
2.061
+2.061
0.0%
1 gen 1997 anni
1.417
-0.644
-31.25%
1 gen 1998 anni
1.732
+0.315
22.24%
1 gen 1999 anni
2.379
+0.647
37.34%
1 gen 2000 anni
3.149
+0.77
32.36%
1 gen 2001 anni
3.09
-0.058
-1.86%
1 gen 2002 anni
2.772
-0.318
-10.29%
1 gen 2003 anni
3.107
+0.335
12.07%
1 gen 2004 anni
3.237
+0.13
4.2%
1 gen 2005 anni
3.138
-0.099
-3.05%
1 gen 2006 anni
3.134
-0.005
-0.15%
1 gen 2007 anni
2.928
-0.205
-6.56%
1 gen 2008 anni
2.862
-0.066
-2.25%
1 gen 2009 anni
2.675
-0.188
-6.55%
1 gen 2010 anni
3.118
+0.443
16.57%
1 gen 2011 anni
2.57
-0.548
-17.59%
1 gen 2012 anni
2.335
-0.235
-9.14%
1 gen 2013 anni
2.45
+0.115
4.93%
1 gen 2014 anni
2.508
+0.059
2.39%
1 gen 2015 anni
2.803
+0.295
11.77%
Classificazione dei paesi secondo i statistiche attuali per anni