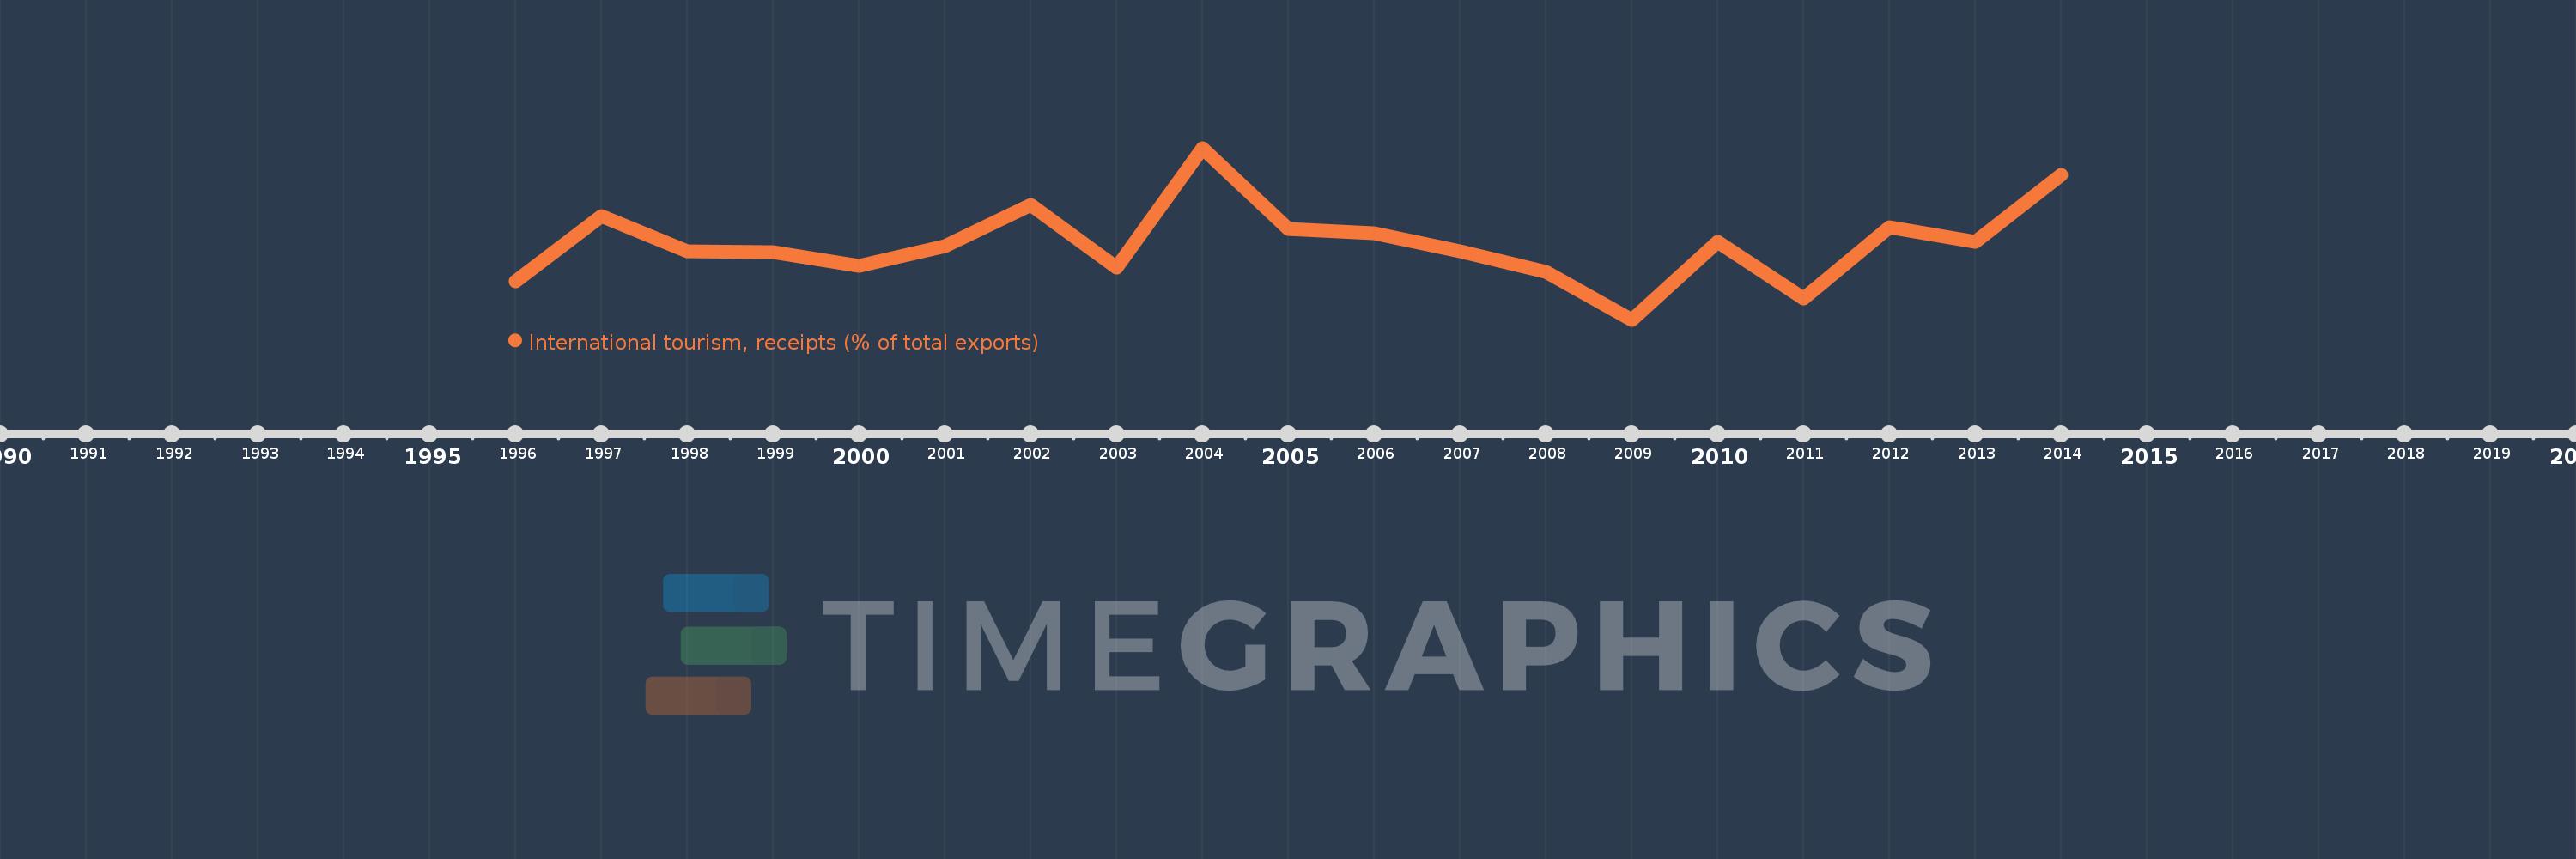
Questa scala temporale mostra un grafico dal 1996 anno al 2014 anno. Cameroon. I dati fino ad 1995 anno non disponibili. Il numero di osservazioni attuali secondo i date: 19.
La fonte (nome):
Indicatori dello sviluppo mondiale
La fonte (organizzazione):
World Tourism Organization, Yearbook of Tourism Statistics, Compendium of Tourism Statistics and data files, and IMF and World Bank exports estimates.
Categorie:
Private Sector, Trade
sono stati aggiornati
23 apr 2017 anni
Indicatori delle variazioni dei valori per anni
In media:
5.049
Minima:
2.28
1 gen 2009 anni
Massimo:
8.504
1 gen 2004 anni
Alla data di osservazione
Valore
Variazione assoluta
La variazione rispetto al valore precedente
1 gen 1996 anni
3.676
+3.676
0.0%
1 gen 1997 anni
6.046
+2.37
64.47%
1 gen 1998 anni
4.77
-1.276
-21.11%
1 gen 1999 anni
4.736
-0.034
-0.71%
1 gen 2000 anni
4.224
-0.511
-10.79%
1 gen 2001 anni
4.95
+0.725
17.17%
1 gen 2002 anni
6.448
+1.498
30.26%
1 gen 2003 anni
4.155
-2.293
-35.56%
1 gen 2004 anni
8.504
+4.349
104.67%
1 gen 2005 anni
5.554
-2.95
-34.69%
1 gen 2006 anni
5.407
-0.147
-2.65%
1 gen 2007 anni
4.748
-0.659
-12.19%
1 gen 2008 anni
4.015
-0.733
-15.44%
1 gen 2009 anni
2.28
-1.735
-43.22%
1 gen 2010 anni
5.101
+2.821
123.73%
1 gen 2011 anni
3.049
-2.051
-40.22%
1 gen 2012 anni
5.632
+2.582
84.69%
1 gen 2013 anni
5.105
-0.527
-9.36%
1 gen 2014 anni
7.533
+2.428
47.56%
Classificazione dei paesi secondo i statistiche attuali per anni