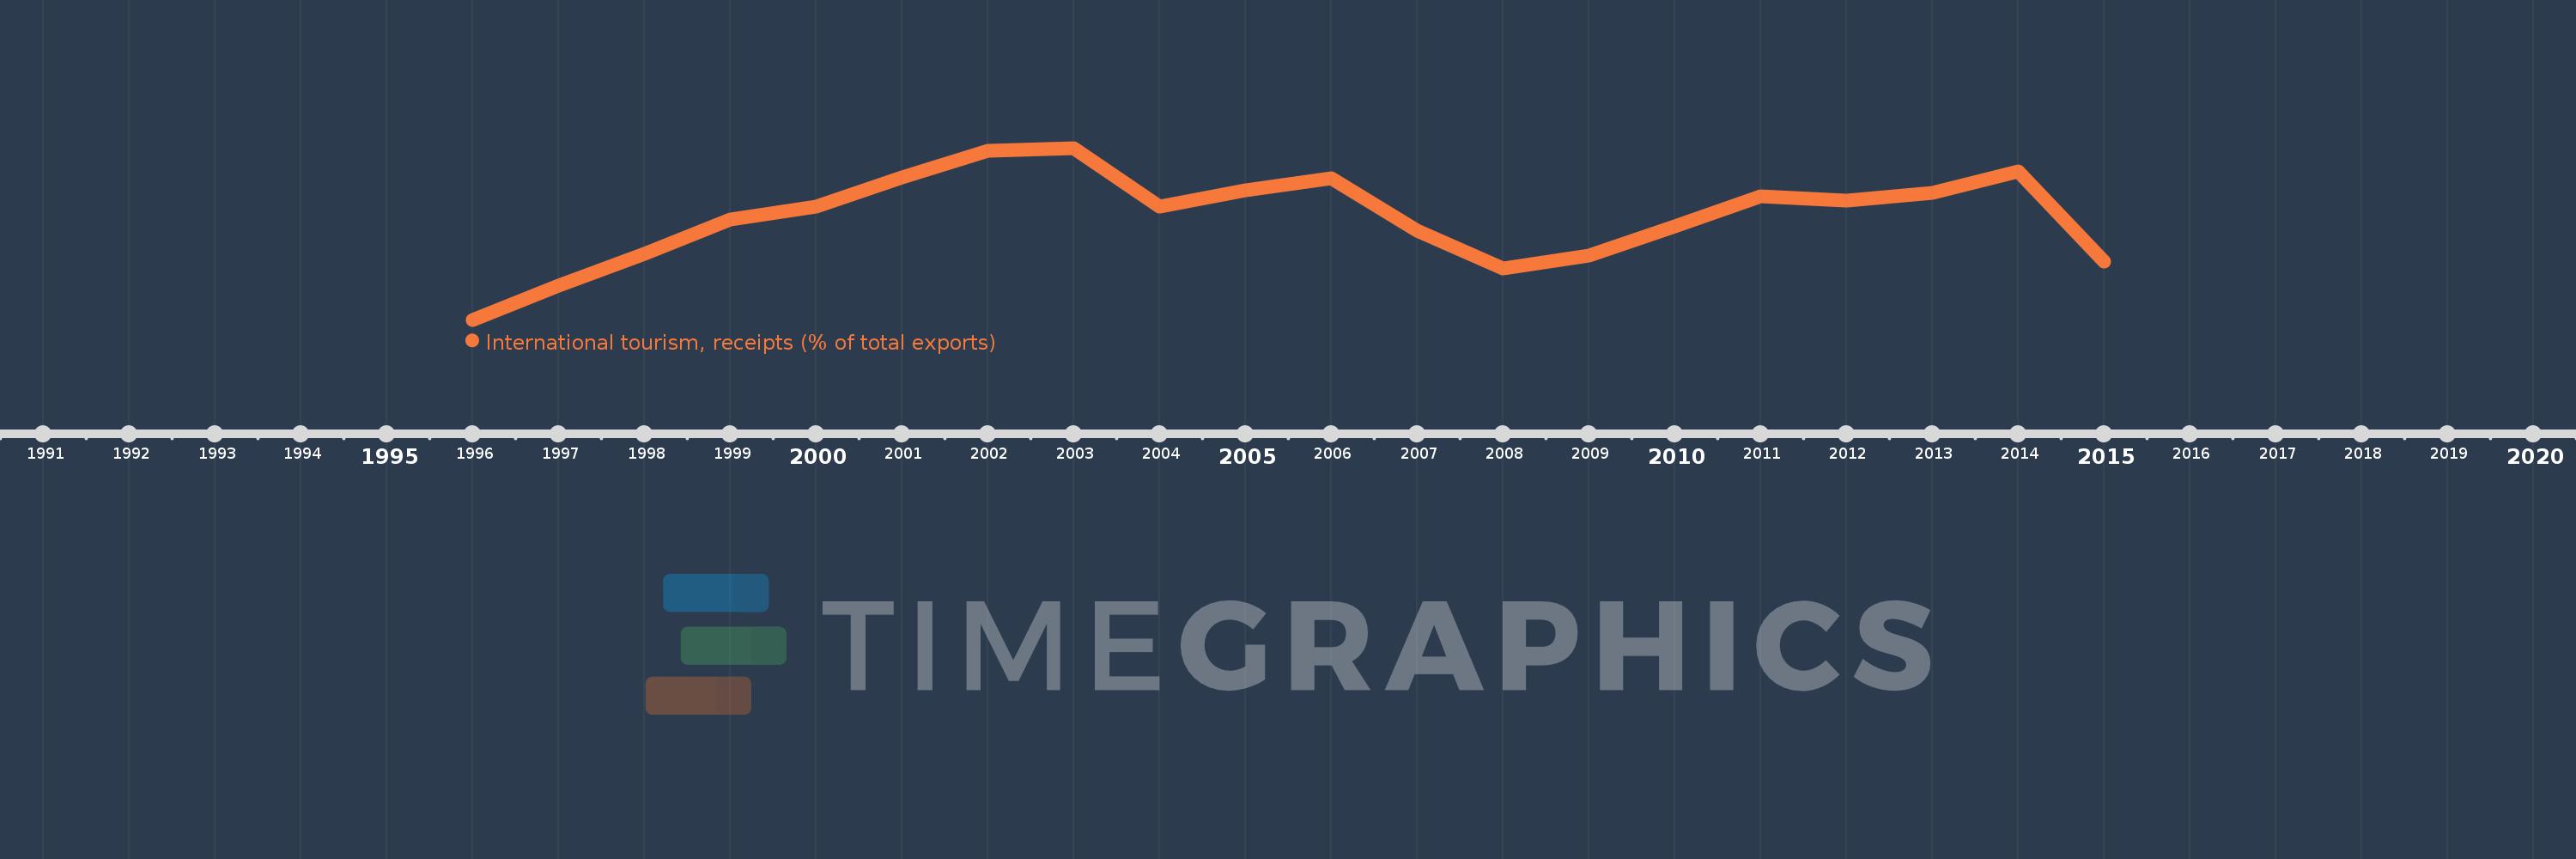
Questa scala temporale mostra un grafico dal 1996 anno al 2015 anno. Uganda. I dati fino ad 1995 anno non disponibili. Il numero di osservazioni attuali secondo i date: 20.
La fonte (nome):
Indicatori dello sviluppo mondiale
La fonte (organizzazione):
World Tourism Organization, Yearbook of Tourism Statistics, Compendium of Tourism Statistics and data files, and IMF and World Bank exports estimates.
Categorie:
Private Sector, Trade
sono stati aggiornati
23 apr 2017 anni
Indicatori delle variazioni dei valori per anni
In media:
21.226
Minima:
11.742
1 gen 1996 anni
Massimo:
27.602
1 gen 2003 anni
Alla data di osservazione
Valore
Variazione assoluta
La variazione rispetto al valore precedente
1 gen 1996 anni
11.742
+11.742
0.0%
1 gen 1997 anni
14.923
+3.181
27.09%
1 gen 1998 anni
17.828
+2.905
19.47%
1 gen 1999 anni
20.977
+3.149
17.66%
1 gen 2000 anni
22.222
+1.246
5.94%
1 gen 2001 anni
24.883
+2.661
11.97%
1 gen 2002 anni
27.333
+2.45
9.84%
1 gen 2003 anni
27.602
+0.269
0.98%
1 gen 2004 anni
22.182
-5.42
-19.64%
1 gen 2005 anni
23.669
+1.487
6.7%
1 gen 2006 anni
24.773
+1.104
4.66%
1 gen 2007 anni
19.993
-4.779
-19.29%
1 gen 2008 anni
16.482
-3.511
-17.56%
1 gen 2009 anni
17.633
+1.151
6.98%
1 gen 2010 anni
20.365
+2.732
15.49%
1 gen 2011 anni
23.128
+2.763
13.57%
1 gen 2012 anni
22.733
-0.395
-1.71%
1 gen 2013 anni
23.476
+0.743
3.27%
1 gen 2014 anni
25.436
+1.959
8.35%
1 gen 2015 anni
17.14
-8.296
-32.61%
Classificazione dei paesi secondo i statistiche attuali per anni