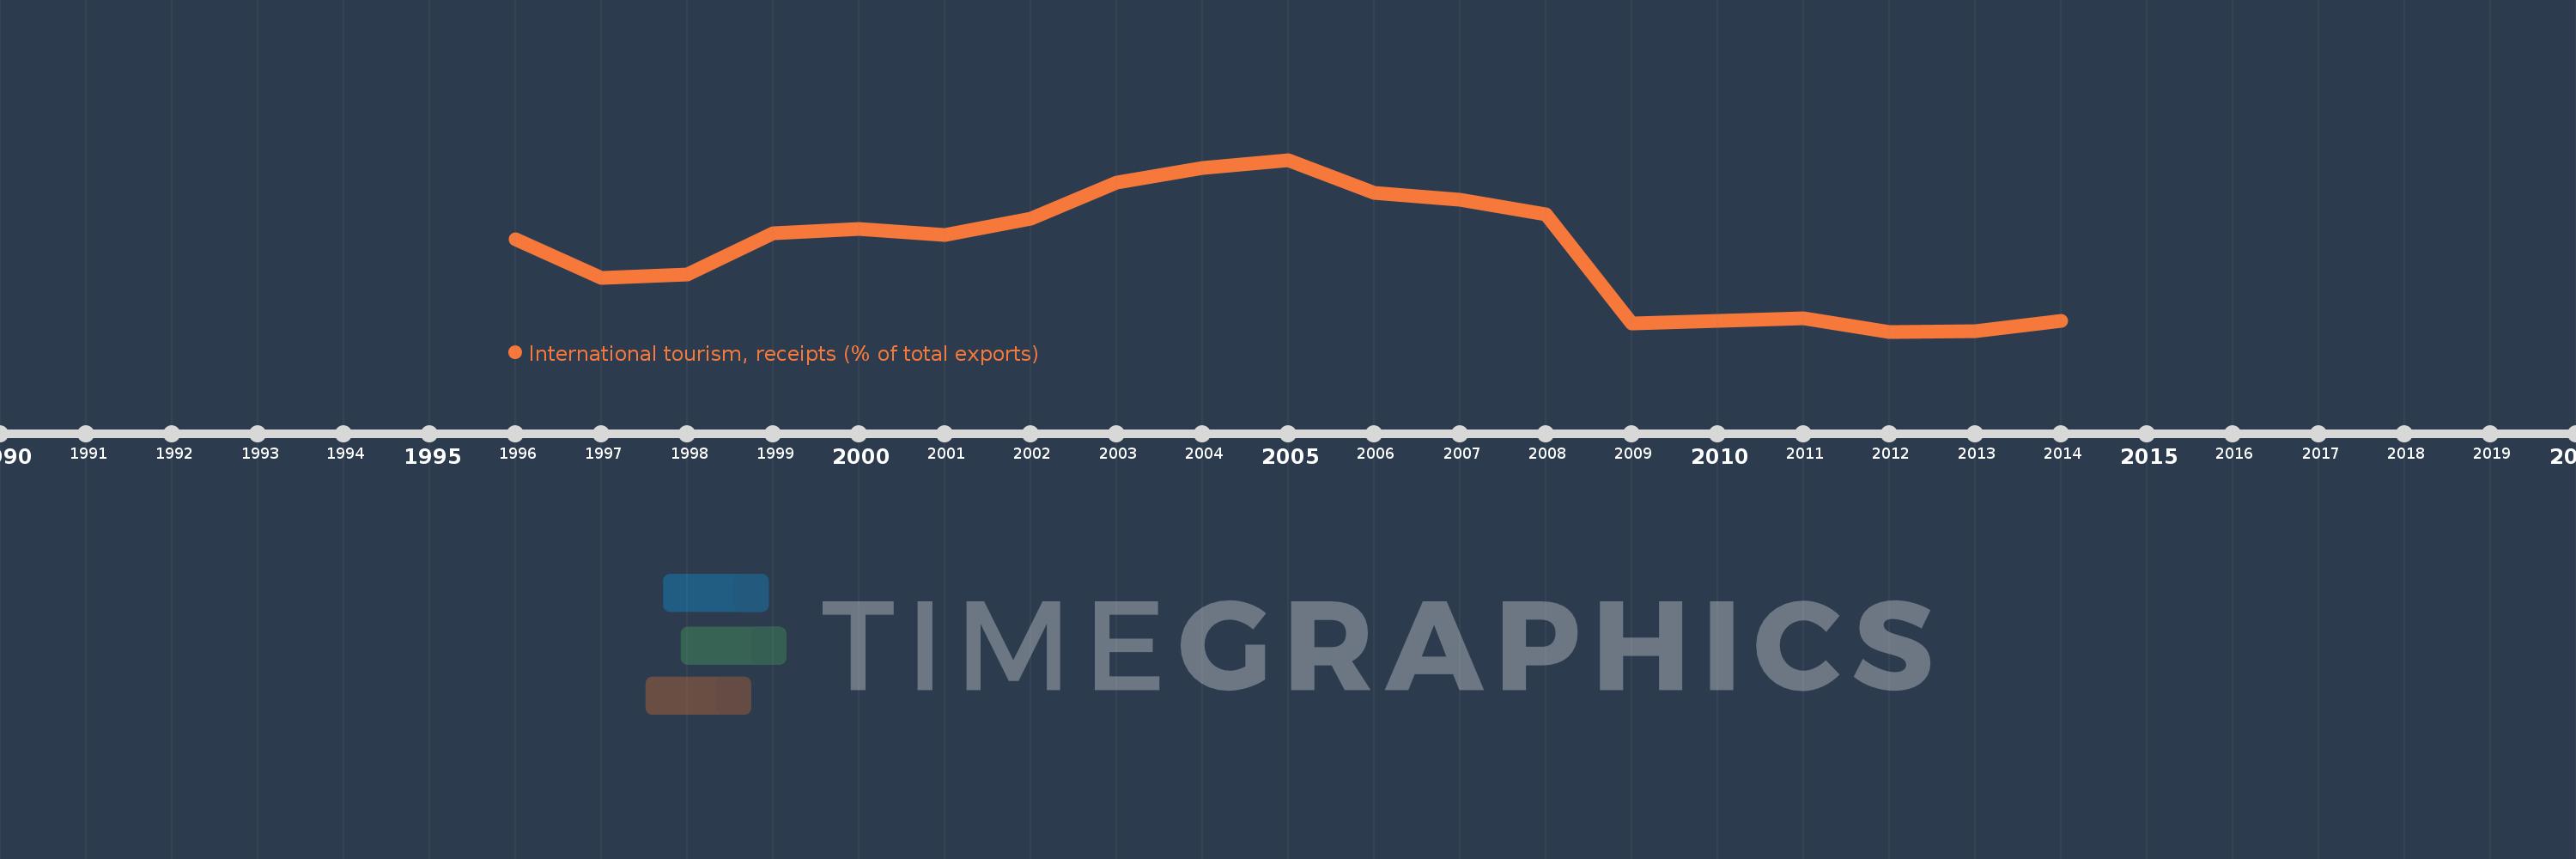
Questa scala temporale mostra un grafico dal 1996 anno al 2014 anno. Botswana. I dati fino ad 1995 anno non disponibili. Il numero di osservazioni attuali secondo i date: 19.
La fonte (nome):
Indicatori dello sviluppo mondiale
La fonte (organizzazione):
World Tourism Organization, Yearbook of Tourism Statistics, Compendium of Tourism Statistics and data files, and IMF and World Bank exports estimates.
Categorie:
Private Sector, Trade
sono stati aggiornati
23 apr 2017 anni
Indicatori delle variazioni dei valori per anni
In media:
6.391
Minima:
0.469
1 gen 2012 anni
Massimo:
13.106
1 gen 2005 anni
Alla data di osservazione
Valore
Variazione assoluta
La variazione rispetto al valore precedente
1 gen 1996 anni
7.271
+7.271
0.0%
1 gen 1997 anni
4.411
-2.86
-39.34%
1 gen 1998 anni
4.653
+0.243
5.5%
1 gen 1999 anni
7.73
+3.077
66.12%
1 gen 2000 anni
7.995
+0.265
3.42%
1 gen 2001 anni
7.566
-0.429
-5.36%
1 gen 2002 anni
8.797
+1.231
16.27%
1 gen 2003 anni
11.421
+2.624
29.83%
1 gen 2004 anni
12.516
+1.095
9.59%
1 gen 2005 anni
13.106
+0.589
4.71%
1 gen 2006 anni
10.67
-2.436
-18.59%
1 gen 2007 anni
10.186
-0.484
-4.53%
1 gen 2008 anni
9.115
-1.071
-10.51%
1 gen 2009 anni
1.078
-8.037
-88.17%
1 gen 2010 anni
1.259
+0.18
16.74%
1 gen 2011 anni
1.434
+0.175
13.9%
1 gen 2012 anni
0.469
-0.965
-67.26%
1 gen 2013 anni
0.522
+0.052
11.1%
1 gen 2014 anni
1.233
+0.711
136.33%
Classificazione dei paesi secondo i statistiche attuali per anni