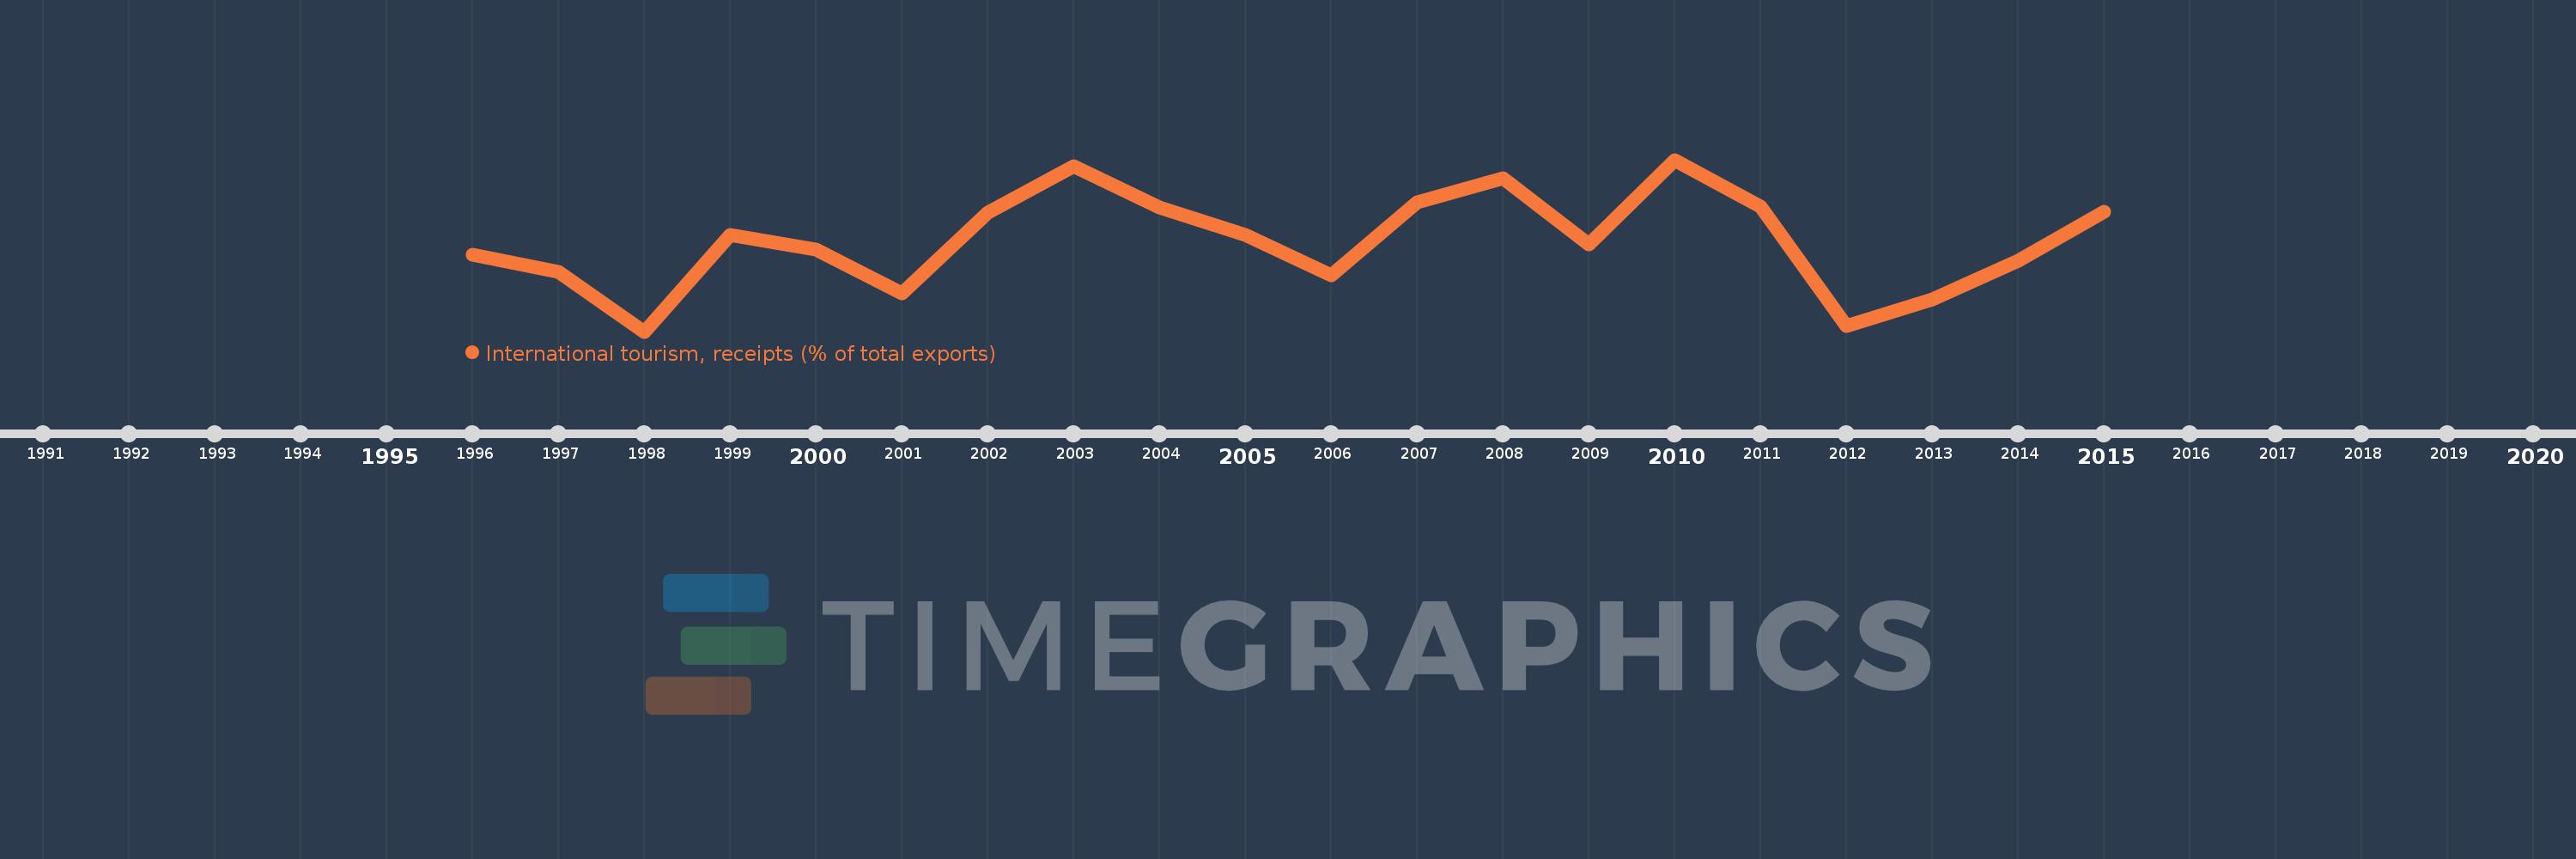
Questa scala temporale mostra un grafico dal 1996 anno al 2015 anno. Sweden. I dati fino ad 1995 anno non disponibili. Il numero di osservazioni attuali secondo i date: 20.
La fonte (nome):
Indicatori dello sviluppo mondiale
La fonte (organizzazione):
World Tourism Organization, Yearbook of Tourism Statistics, Compendium of Tourism Statistics and data files, and IMF and World Bank exports estimates.
Categorie:
Private Sector, Trade
sono stati aggiornati
23 apr 2017 anni
Indicatori delle variazioni dei valori per anni
In media:
4.717
Minima:
3.998
1 gen 1998 anni
Massimo:
5.363
1 gen 2010 anni
Alla data di osservazione
Valore
Variazione assoluta
La variazione rispetto al valore precedente
1 gen 1996 anni
4.609
+4.609
0.0%
1 gen 1997 anni
4.474
-0.135
-2.93%
1 gen 1998 anni
3.998
-0.476
-10.64%
1 gen 1999 anni
4.768
+0.77
19.27%
1 gen 2000 anni
4.652
-0.116
-2.43%
1 gen 2001 anni
4.299
-0.353
-7.58%
1 gen 2002 anni
4.943
+0.644
14.97%
1 gen 2003 anni
5.309
+0.366
7.4%
1 gen 2004 anni
4.982
-0.327
-6.16%
1 gen 2005 anni
4.767
-0.215
-4.31%
1 gen 2006 anni
4.448
-0.319
-6.69%
1 gen 2007 anni
5.027
+0.579
13.01%
1 gen 2008 anni
5.219
+0.192
3.82%
1 gen 2009 anni
4.692
-0.527
-10.1%
1 gen 2010 anni
5.363
+0.67
14.28%
1 gen 2011 anni
4.99
-0.373
-6.95%
1 gen 2012 anni
4.039
-0.95
-19.04%
1 gen 2013 anni
4.257
+0.218
5.39%
1 gen 2014 anni
4.562
+0.304
7.15%
1 gen 2015 anni
4.949
+0.387
8.49%
Classificazione dei paesi secondo i statistiche attuali per anni