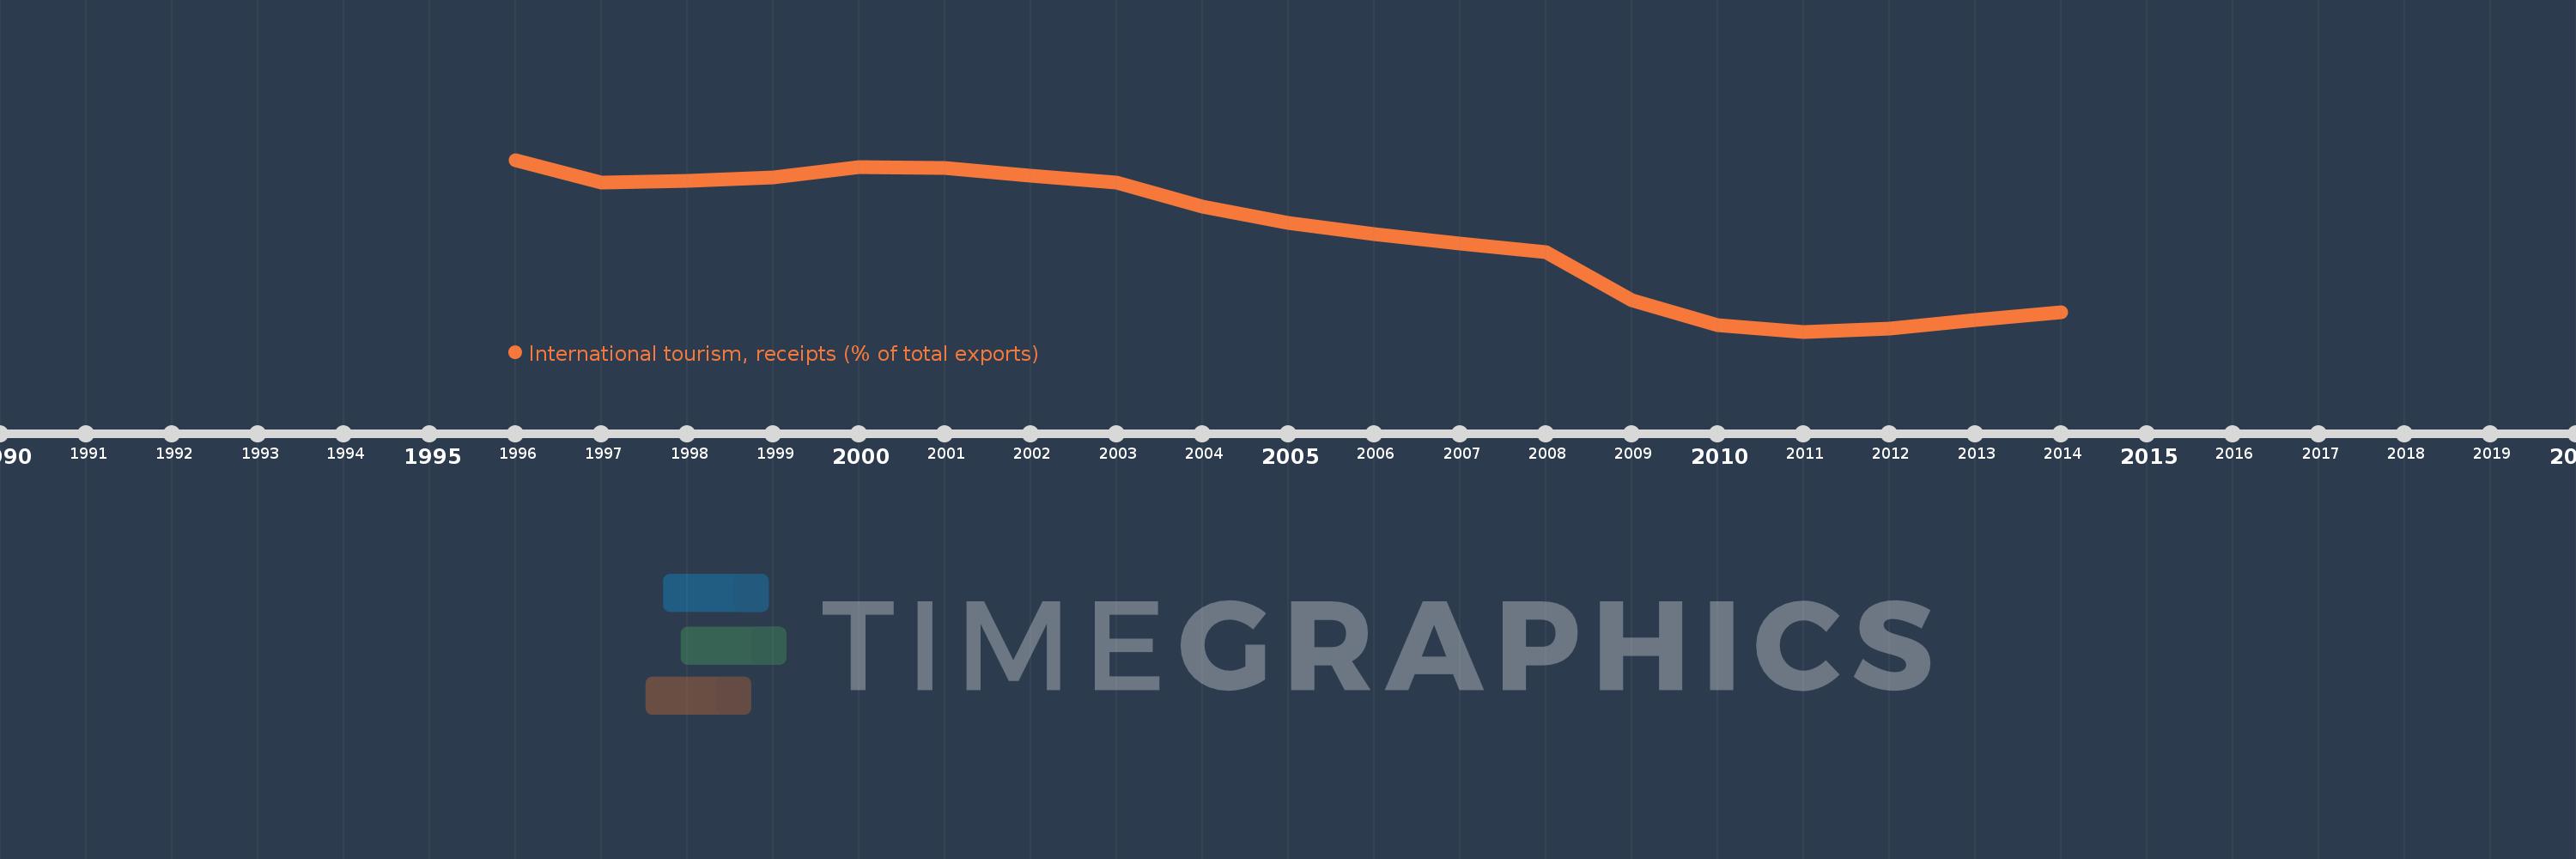
Questa scala temporale mostra un grafico dal 1996 anno al 2014 anno. Cyprus. I dati fino ad 1995 anno non disponibili. Il numero di osservazioni attuali secondo i date: 19.
La fonte (nome):
Indicatori dello sviluppo mondiale
La fonte (organizzazione):
World Tourism Organization, Yearbook of Tourism Statistics, Compendium of Tourism Statistics and data files, and IMF and World Bank exports estimates.
Categorie:
Private Sector, Trade
sono stati aggiornati
23 apr 2017 anni
Indicatori delle variazioni dei valori per anni
In media:
32.671
Minima:
18.488
1 gen 2011 anni
Massimo:
43.809
1 gen 1996 anni
Alla data di osservazione
Valore
Variazione assoluta
La variazione rispetto al valore precedente
1 gen 1996 anni
43.809
+43.809
0.0%
1 gen 1997 anni
40.513
-3.296
-7.52%
1 gen 1998 anni
40.651
+0.138
0.34%
1 gen 1999 anni
41.164
+0.513
1.26%
1 gen 2000 anni
42.751
+1.587
3.85%
1 gen 2001 anni
42.578
-0.173
-0.4%
1 gen 2002 anni
41.447
-1.132
-2.66%
1 gen 2003 anni
40.466
-0.981
-2.37%
1 gen 2004 anni
36.923
-3.543
-8.75%
1 gen 2005 anni
34.447
-2.476
-6.71%
1 gen 2006 anni
32.858
-1.589
-4.61%
1 gen 2007 anni
31.464
-1.394
-4.24%
1 gen 2008 anni
30.216
-1.248
-3.97%
1 gen 2009 anni
23.07
-7.146
-23.65%
1 gen 2010 anni
19.477
-3.593
-15.57%
1 gen 2011 anni
18.488
-0.989
-5.08%
1 gen 2012 anni
18.916
+0.428
2.31%
1 gen 2013 anni
20.186
+1.27
6.72%
1 gen 2014 anni
21.331
+1.145
5.67%
Classificazione dei paesi secondo i statistiche attuali per anni