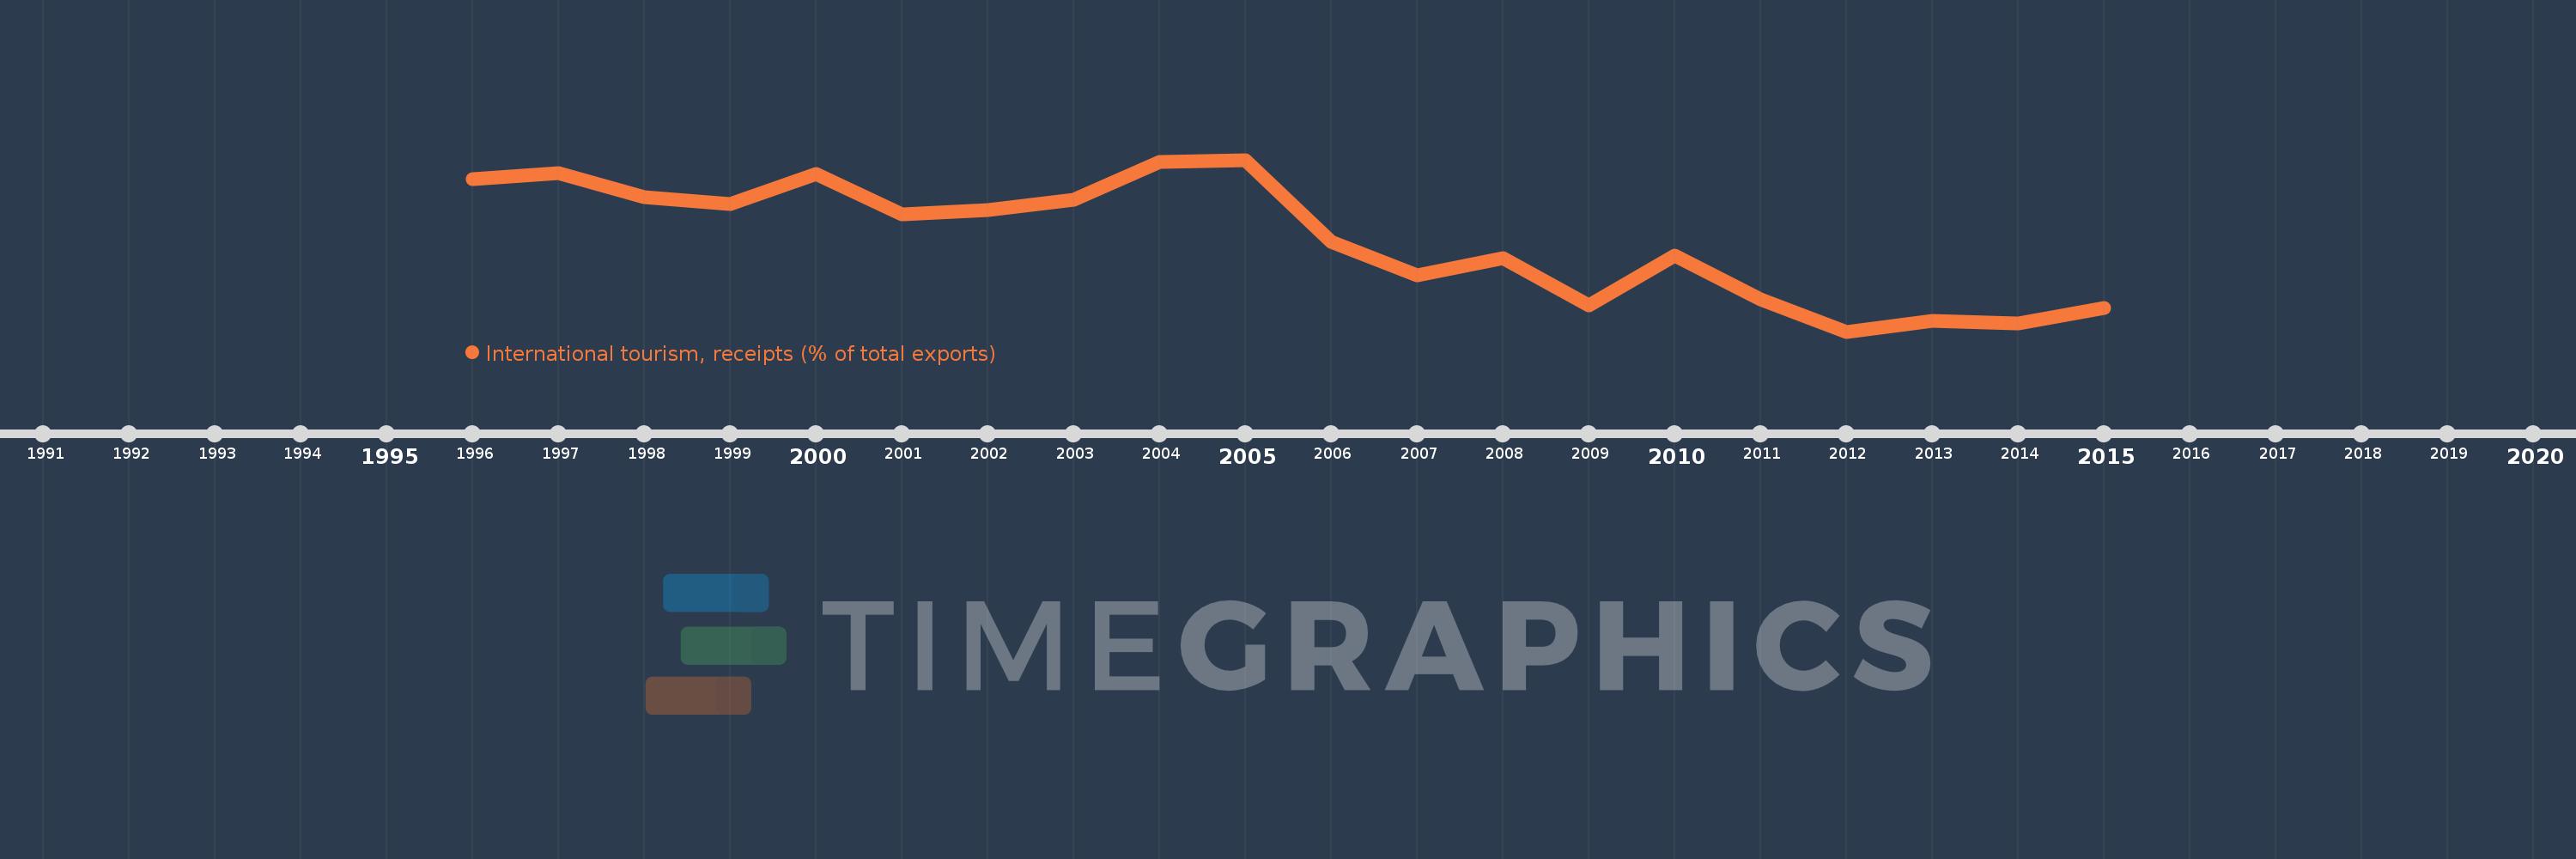
Questa scala temporale mostra un grafico dal 1996 anno al 2015 anno. Australia. I dati fino ad 1995 anno non disponibili. Il numero di osservazioni attuali secondo i date: 20.
La fonte (nome):
Indicatori dello sviluppo mondiale
La fonte (organizzazione):
World Tourism Organization, Yearbook of Tourism Statistics, Compendium of Tourism Statistics and data files, and IMF and World Bank exports estimates.
Categorie:
Private Sector, Trade
sono stati aggiornati
23 apr 2017 anni
Indicatori delle variazioni dei valori per anni
In media:
14.445
Minima:
10.584
1 gen 2012 anni
Massimo:
17.8
1 gen 2005 anni
Alla data di osservazione
Valore
Variazione assoluta
La variazione rispetto al valore precedente
1 gen 1996 anni
16.977
+16.977
0.0%
1 gen 1997 anni
17.258
+0.28
1.65%
1 gen 1998 anni
16.231
-1.027
-5.95%
1 gen 1999 anni
15.949
-0.282
-1.74%
1 gen 2000 anni
17.196
+1.247
7.82%
1 gen 2001 anni
15.497
-1.699
-9.88%
1 gen 2002 anni
15.696
+0.199
1.28%
1 gen 2003 anni
16.124
+0.428
2.72%
1 gen 2004 anni
17.693
+1.569
9.73%
1 gen 2005 anni
17.8
+0.108
0.61%
1 gen 2006 anni
14.346
-3.454
-19.4%
1 gen 2007 anni
12.937
-1.409
-9.82%
1 gen 2008 anni
13.675
+0.738
5.7%
1 gen 2009 anni
11.685
-1.99
-14.55%
1 gen 2010 anni
13.792
+2.107
18.03%
1 gen 2011 anni
11.936
-1.856
-13.46%
1 gen 2012 anni
10.584
-1.353
-11.33%
1 gen 2013 anni
11.045
+0.461
4.36%
1 gen 2014 anni
10.911
-0.134
-1.21%
1 gen 2015 anni
11.567
+0.657
6.02%
Classificazione dei paesi secondo i statistiche attuali per anni