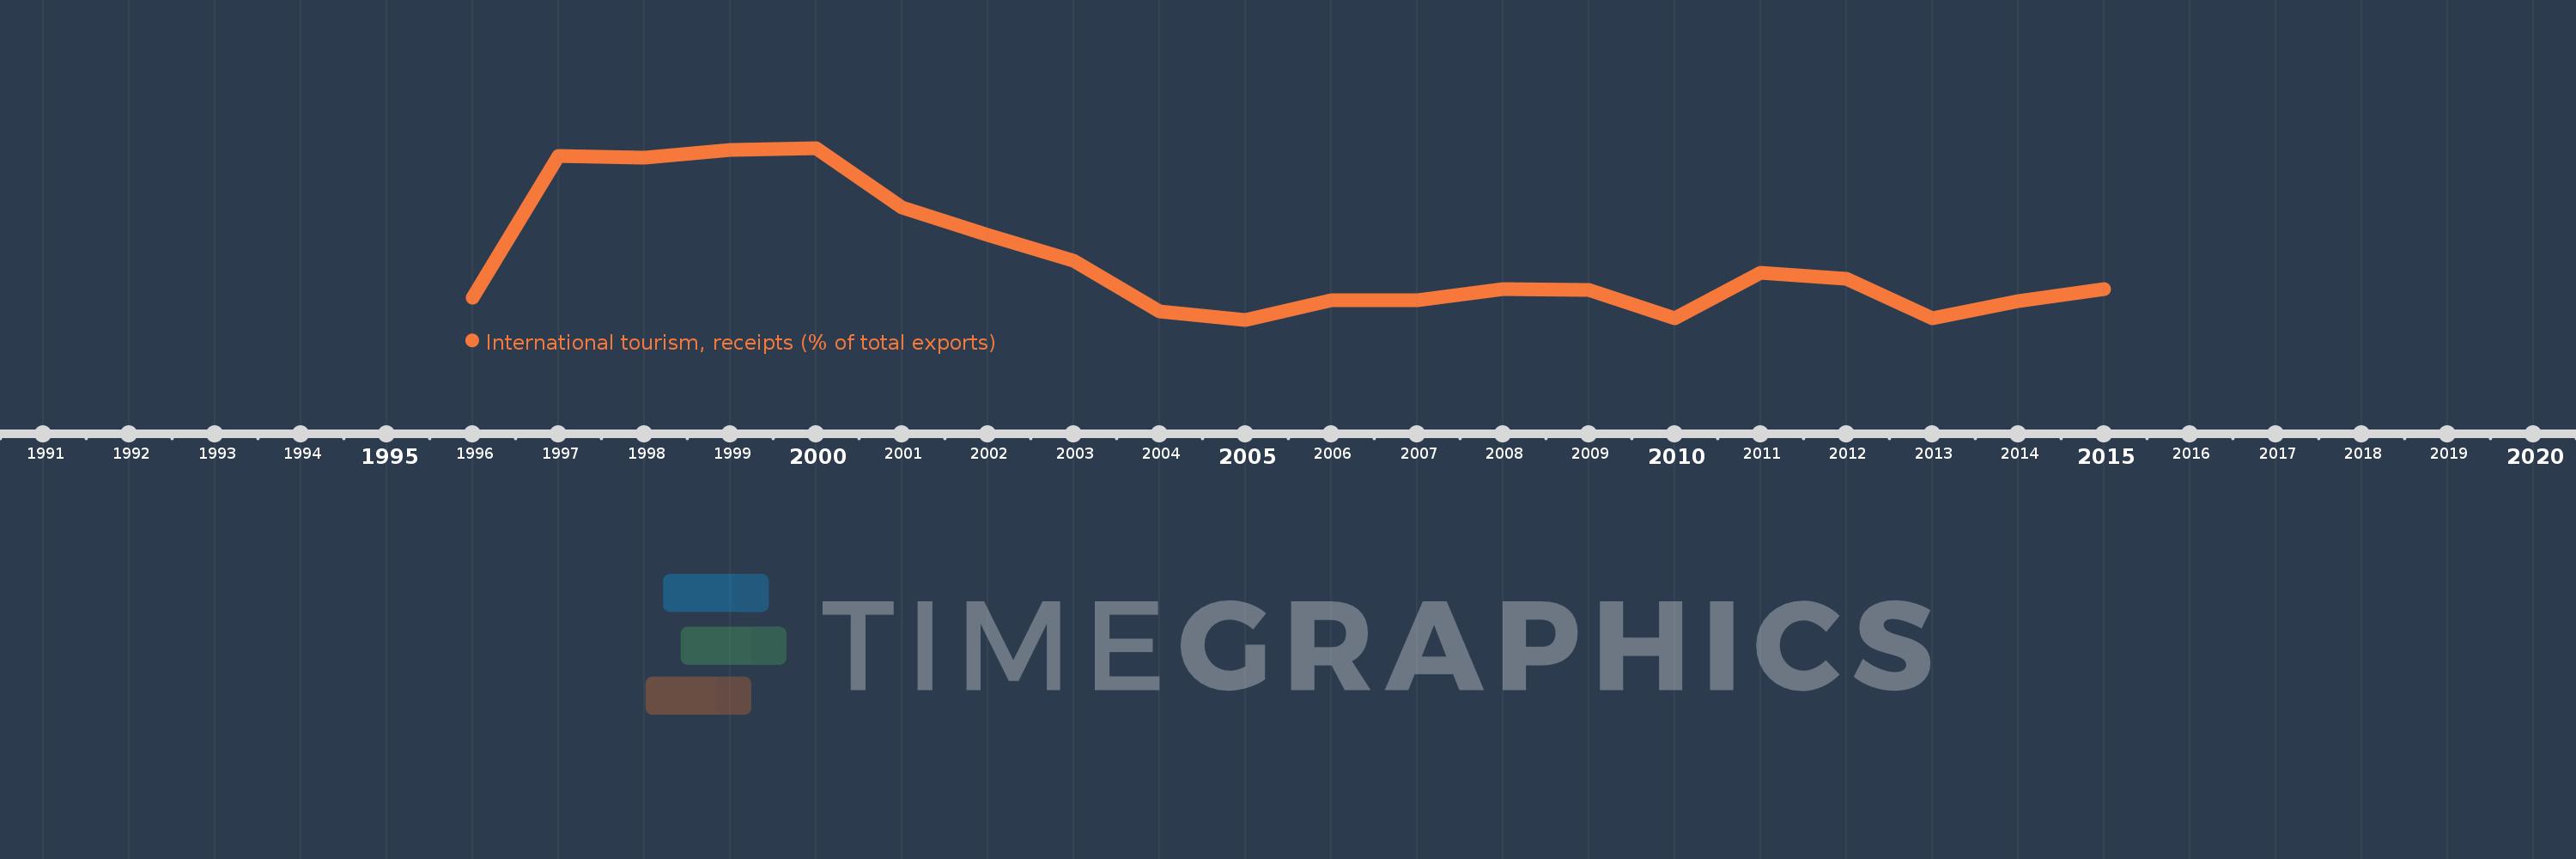
Questa scala temporale mostra un grafico dal 1996 anno al 2015 anno. Guyana. I dati fino ad 1995 anno non disponibili. Il numero di osservazioni attuali secondo i date: 20.
La fonte (nome):
Indicatori dello sviluppo mondiale
La fonte (organizzazione):
World Tourism Organization, Yearbook of Tourism Statistics, Compendium of Tourism Statistics and data files, and IMF and World Bank exports estimates.
Categorie:
Private Sector, Trade
sono stati aggiornati
23 apr 2017 anni
Indicatori delle variazioni dei valori per anni
In media:
8.025
Minima:
3.625
1 gen 2005 anni
Massimo:
16.286
1 gen 2000 anni
Alla data di osservazione
Valore
Variazione assoluta
La variazione rispetto al valore precedente
1 gen 1996 anni
5.245
+5.245
0.0%
1 gen 1997 anni
15.722
+10.477
199.74%
1 gen 1998 anni
15.568
-0.154
-0.98%
1 gen 1999 anni
16.16
+0.592
3.8%
1 gen 2000 anni
16.286
+0.126
0.78%
1 gen 2001 anni
11.901
-4.384
-26.92%
1 gen 2002 anni
9.887
-2.014
-16.92%
1 gen 2003 anni
8.001
-1.886
-19.08%
1 gen 2004 anni
4.212
-3.789
-47.36%
1 gen 2005 anni
3.625
-0.587
-13.94%
1 gen 2006 anni
5.047
+1.422
39.24%
1 gen 2007 anni
5.088
+0.041
0.81%
1 gen 2008 anni
5.898
+0.81
15.92%
1 gen 2009 anni
5.822
-0.076
-1.29%
1 gen 2010 anni
3.729
-2.093
-35.94%
1 gen 2011 anni
7.061
+3.331
89.33%
1 gen 2012 anni
6.659
-0.402
-5.69%
1 gen 2013 anni
3.736
-2.923
-43.9%
1 gen 2014 anni
5.001
+1.265
33.86%
1 gen 2015 anni
5.86
+0.86
17.19%
Classificazione dei paesi secondo i statistiche attuali per anni