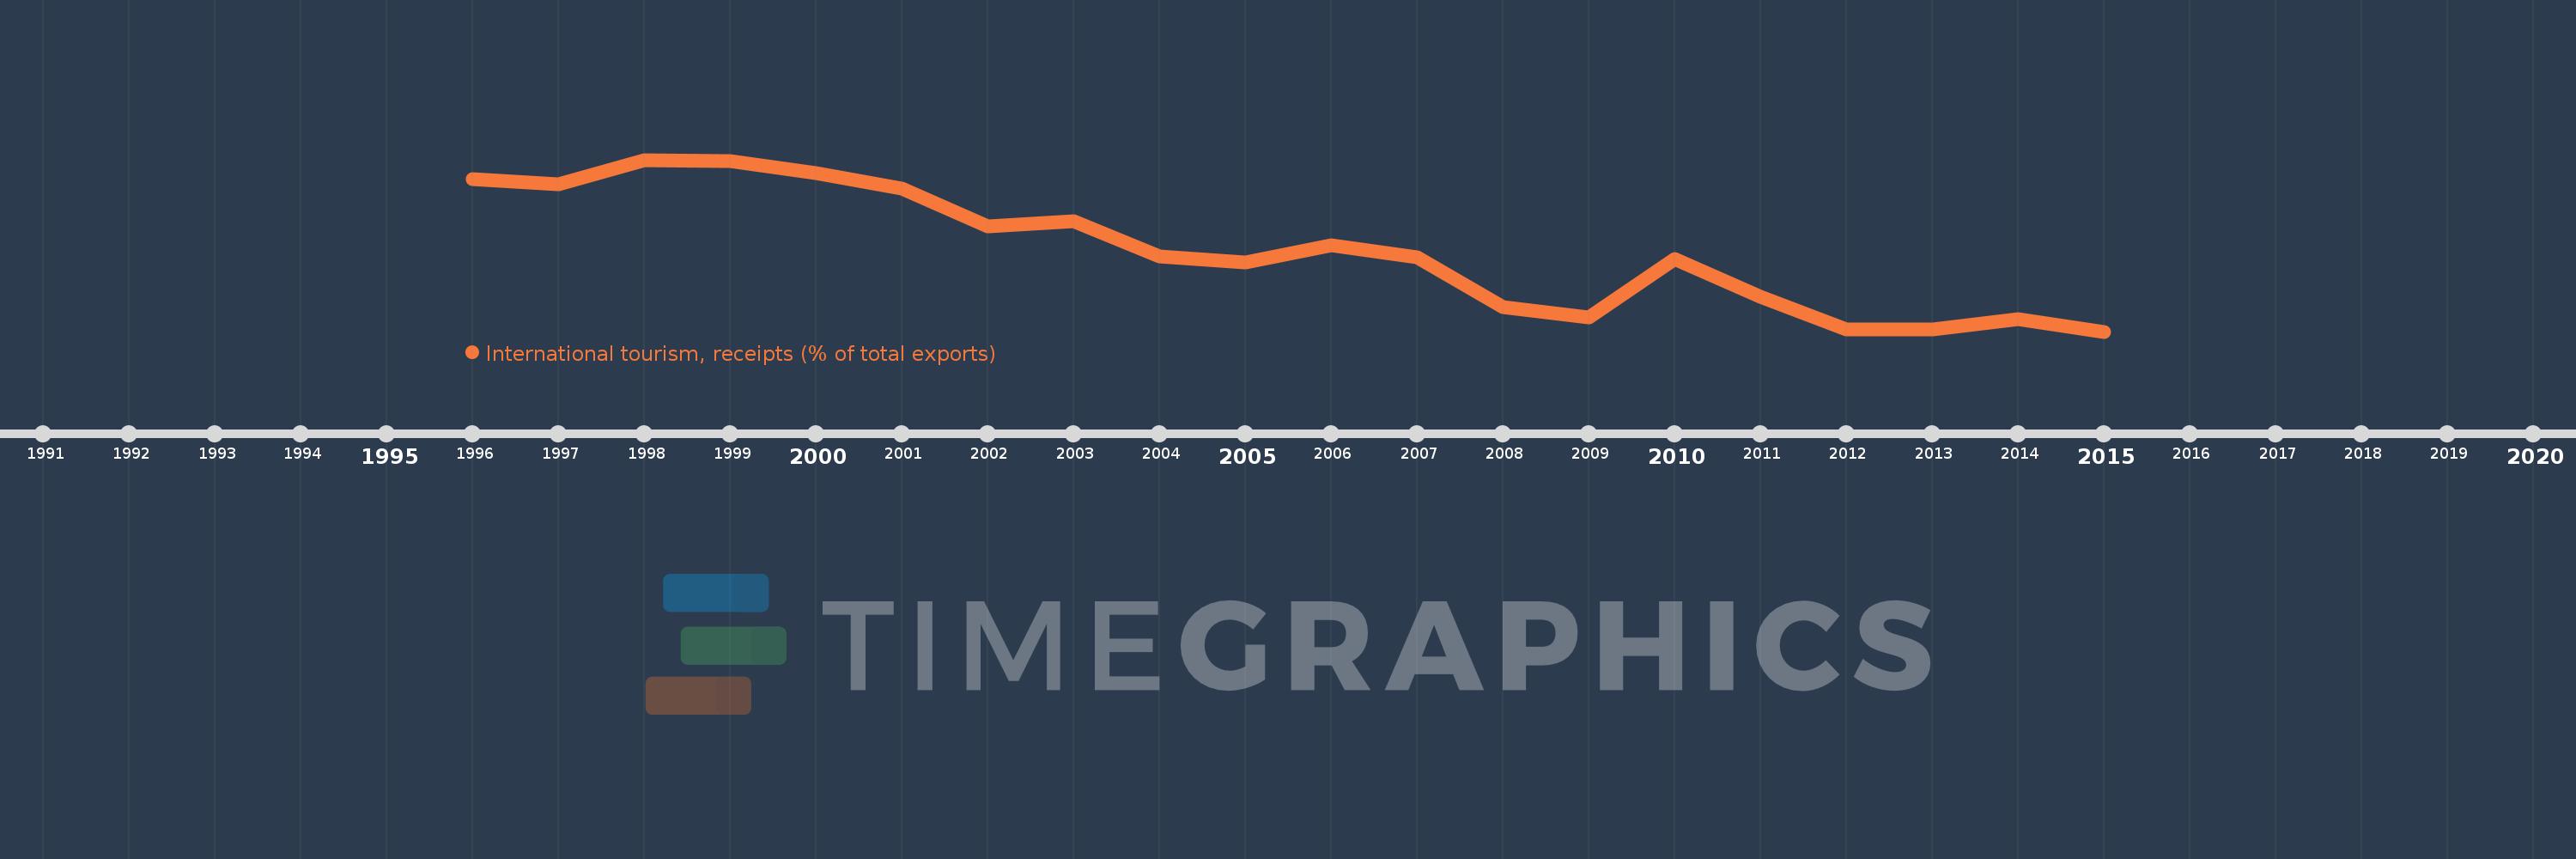
Questa scala temporale mostra un grafico dal 1996 anno al 2015 anno. Germany. I dati fino ad 1995 anno non disponibili. Il numero di osservazioni attuali secondo i date: 20.
La fonte (nome):
Indicatori dello sviluppo mondiale
La fonte (organizzazione):
World Tourism Organization, Yearbook of Tourism Statistics, Compendium of Tourism Statistics and data files, and IMF and World Bank exports estimates.
Categorie:
Private Sector, Trade
sono stati aggiornati
23 apr 2017 anni
Indicatori delle variazioni dei valori per anni
In media:
3.722
Minima:
3.157
1 gen 2015 anni
Massimo:
4.351
1 gen 1998 anni
Alla data di osservazione
Valore
Variazione assoluta
La variazione rispetto al valore precedente
1 gen 1996 anni
4.215
+4.215
0.0%
1 gen 1997 anni
4.182
-0.033
-0.78%
1 gen 1998 anni
4.351
+0.169
4.04%
1 gen 1999 anni
4.342
-0.009
-0.21%
1 gen 2000 anni
4.261
-0.081
-1.88%
1 gen 2001 anni
4.15
-0.11
-2.59%
1 gen 2002 anni
3.887
-0.263
-6.34%
1 gen 2003 anni
3.923
+0.036
0.93%
1 gen 2004 anni
3.678
-0.245
-6.26%
1 gen 2005 anni
3.637
-0.041
-1.11%
1 gen 2006 anni
3.755
+0.117
3.23%
1 gen 2007 anni
3.676
-0.079
-2.1%
1 gen 2008 anni
3.327
-0.349
-9.48%
1 gen 2009 anni
3.256
-0.071
-2.13%
1 gen 2010 anni
3.659
+0.402
12.35%
1 gen 2011 anni
3.401
-0.258
-7.05%
1 gen 2012 anni
3.174
-0.227
-6.66%
1 gen 2013 anni
3.169
-0.005
-0.15%
1 gen 2014 anni
3.242
+0.073
2.3%
1 gen 2015 anni
3.157
-0.085
-2.63%
Classificazione dei paesi secondo i statistiche attuali per anni