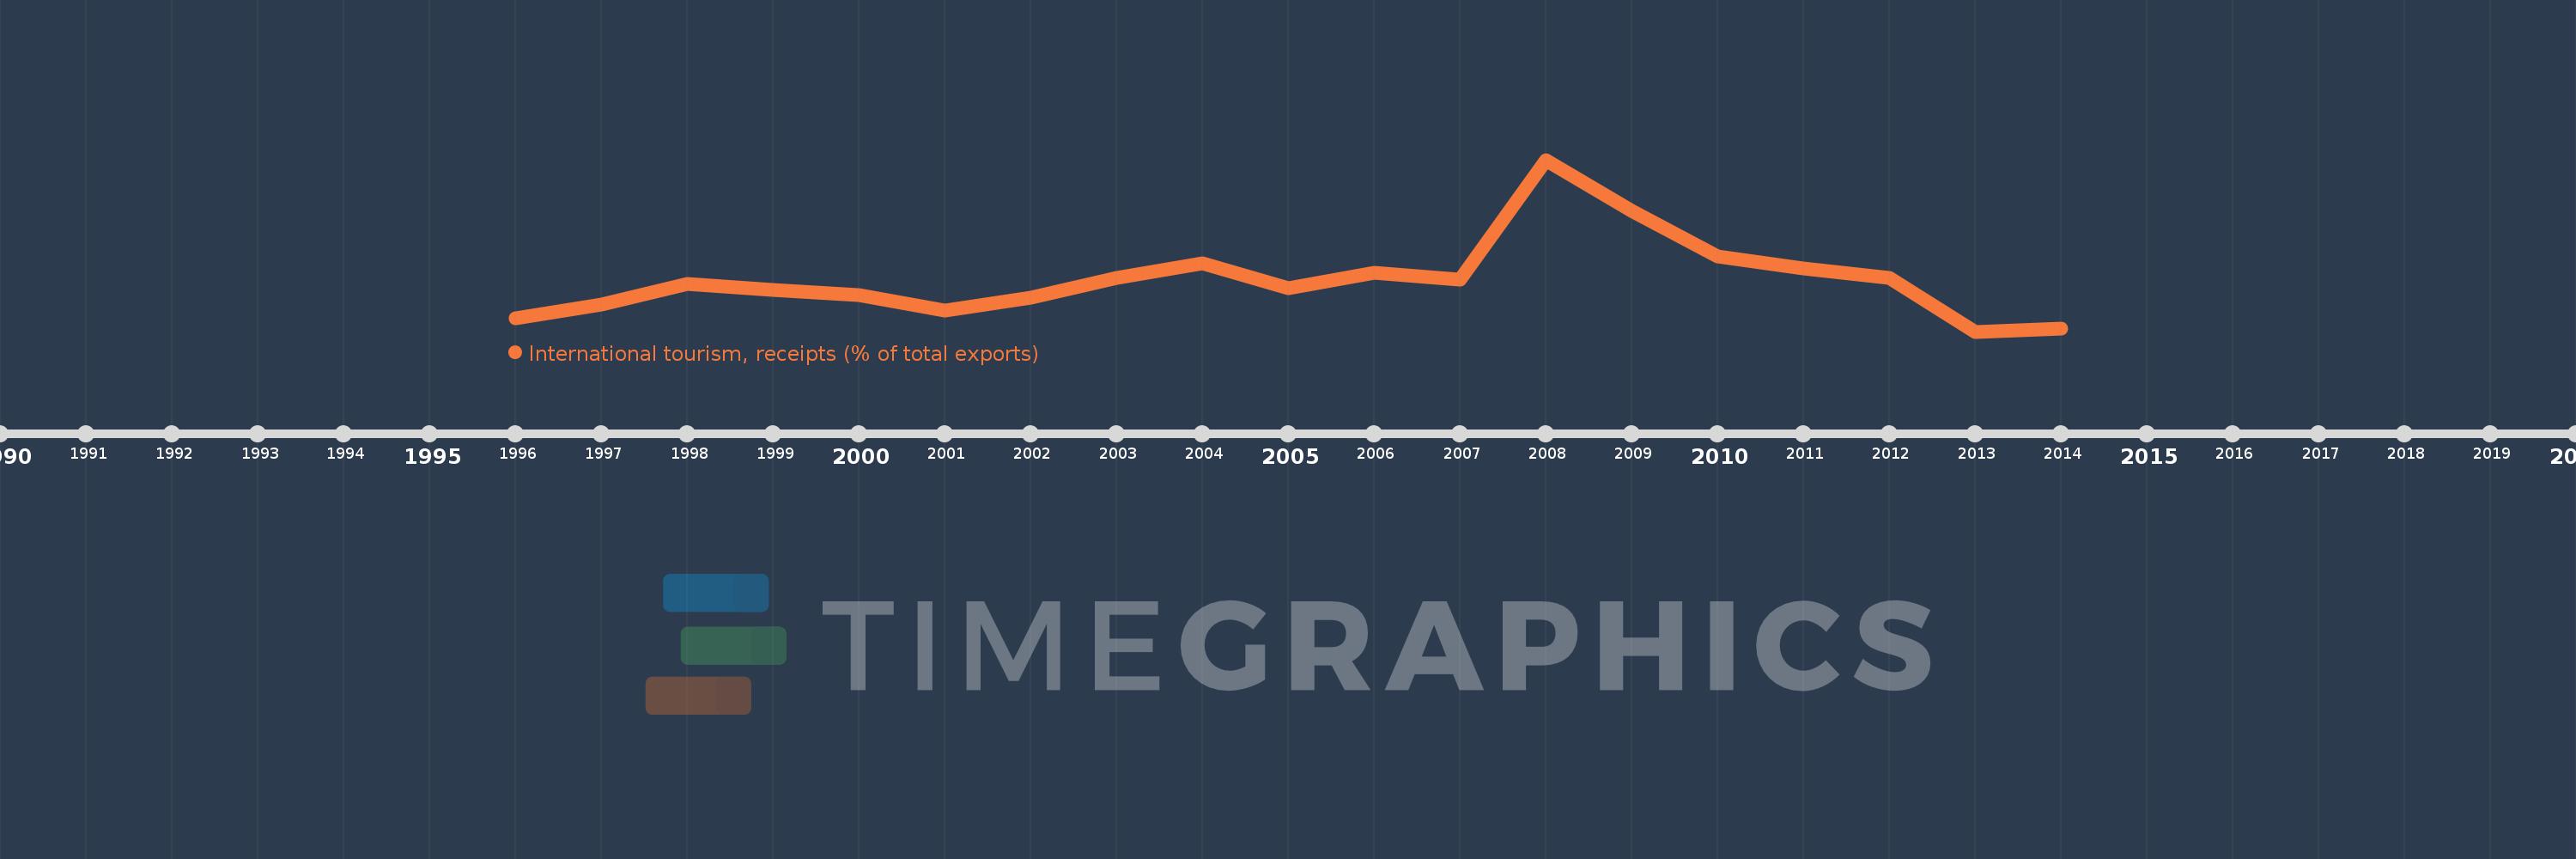
Questa scala temporale mostra un grafico dal 1996 anno al 2014 anno. Senegal. I dati fino ad 1995 anno non disponibili. Il numero di osservazioni attuali secondo i date: 19.
La fonte (nome):
Indicatori dello sviluppo mondiale
La fonte (organizzazione):
World Tourism Organization, Yearbook of Tourism Statistics, Compendium of Tourism Statistics and data files, and IMF and World Bank exports estimates.
Categorie:
Private Sector, Trade
sono stati aggiornati
23 apr 2017 anni
Indicatori delle variazioni dei valori per anni
In media:
13.691
Minima:
10.259
1 gen 2013 anni
Massimo:
21.643
1 gen 2008 anni
Alla data di osservazione
Valore
Variazione assoluta
La variazione rispetto al valore precedente
1 gen 1996 anni
11.169
+11.169
0.0%
1 gen 1997 anni
12.037
+0.868
7.77%
1 gen 1998 anni
13.446
+1.409
11.71%
1 gen 1999 anni
12.997
-0.449
-3.34%
1 gen 2000 anni
12.688
-0.309
-2.37%
1 gen 2001 anni
11.636
-1.052
-8.29%
1 gen 2002 anni
12.499
+0.863
7.42%
1 gen 2003 anni
13.809
+1.309
10.48%
1 gen 2004 anni
14.776
+0.968
7.01%
1 gen 2005 anni
13.127
-1.649
-11.16%
1 gen 2006 anni
14.184
+1.057
8.05%
1 gen 2007 anni
13.704
-0.48
-3.39%
1 gen 2008 anni
21.643
+7.939
57.94%
1 gen 2009 anni
18.231
-3.412
-15.76%
1 gen 2010 anni
15.219
-3.013
-16.53%
1 gen 2011 anni
14.444
-0.775
-5.09%
1 gen 2012 anni
13.834
-0.61
-4.22%
1 gen 2013 anni
10.259
-3.575
-25.84%
1 gen 2014 anni
10.432
+0.173
1.69%
Classificazione dei paesi secondo i statistiche attuali per anni