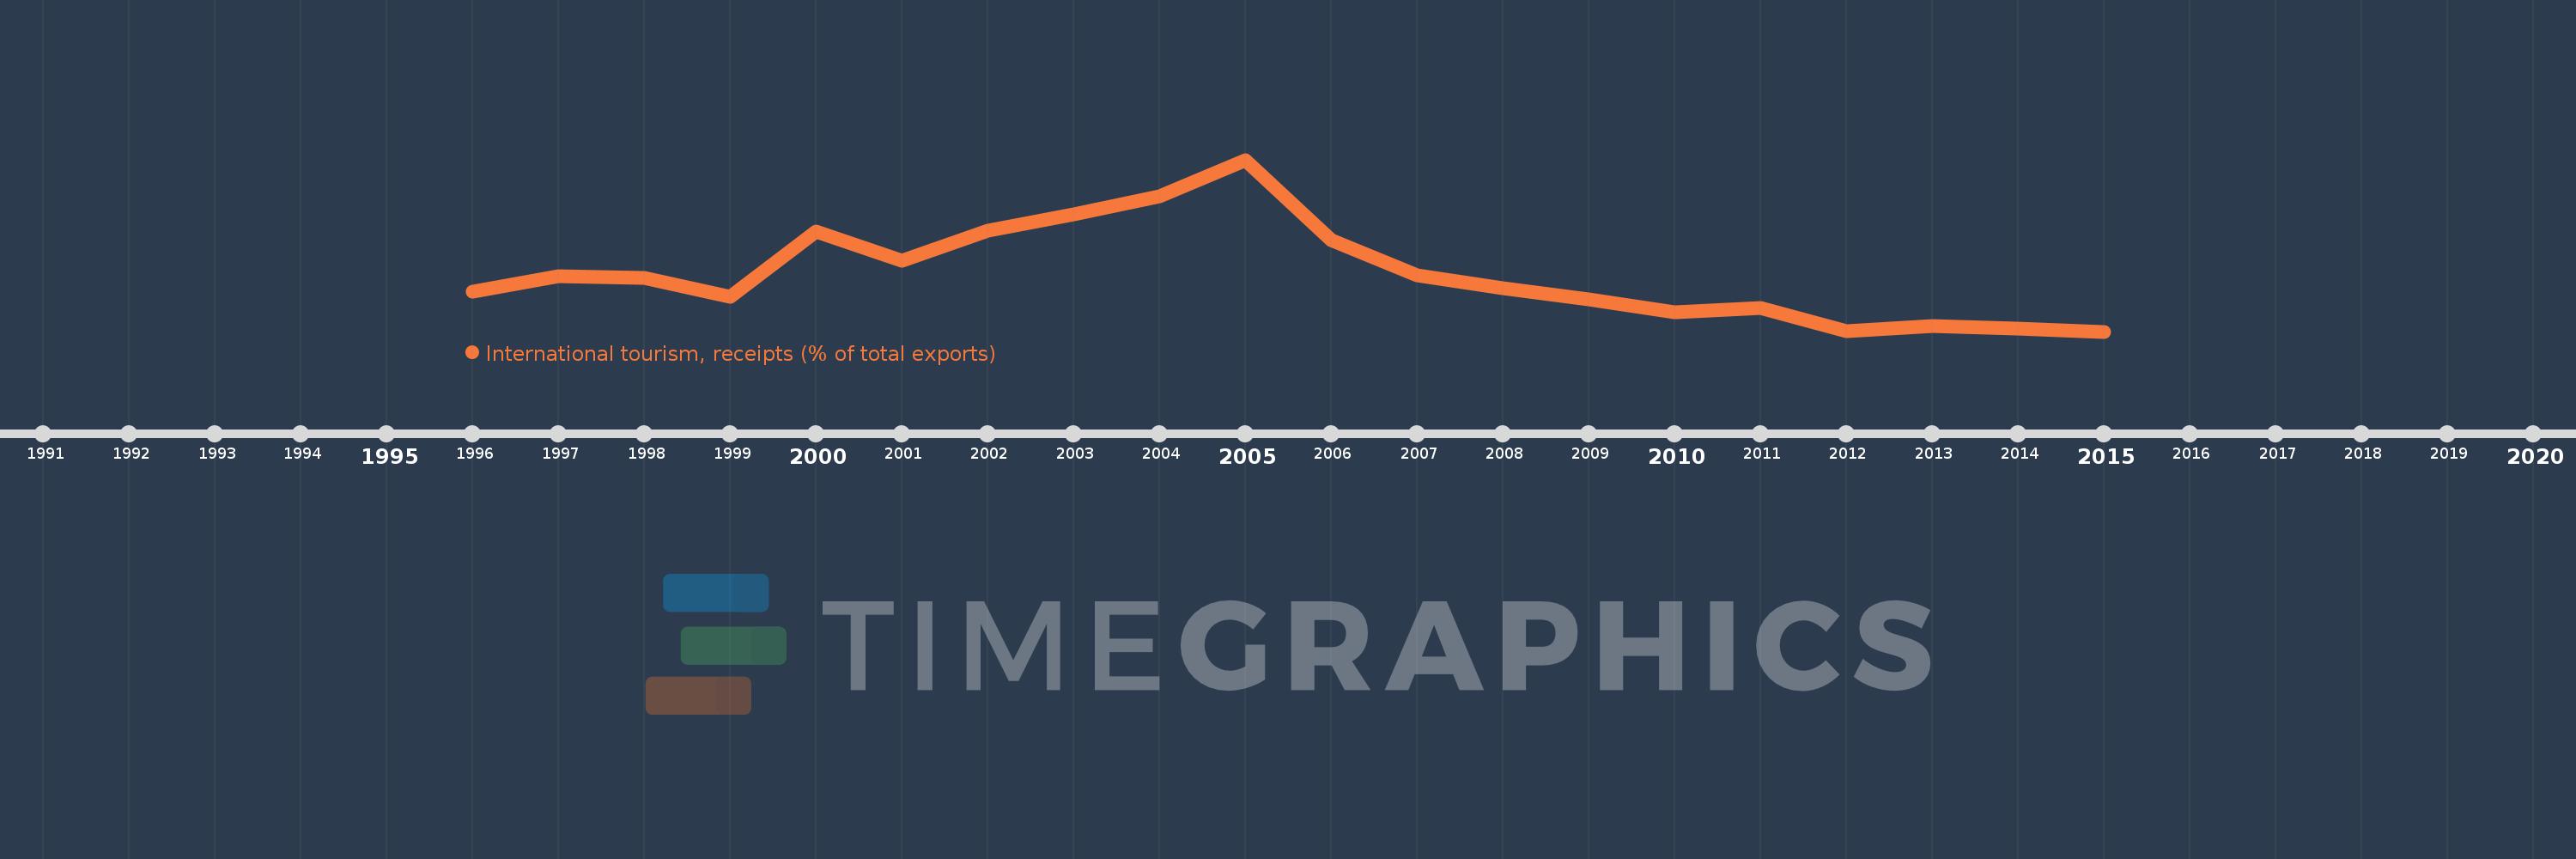
Questa scala temporale mostra un grafico dal 1996 anno al 2015 anno. Malawi. I dati fino ad 1995 anno non disponibili. Il numero di osservazioni attuali secondo i date: 20.
La fonte (nome):
Indicatori dello sviluppo mondiale
La fonte (organizzazione):
World Tourism Organization, Yearbook of Tourism Statistics, Compendium of Tourism Statistics and data files, and IMF and World Bank exports estimates.
Categorie:
Private Sector, Trade
sono stati aggiornati
23 apr 2017 anni
Indicatori delle variazioni dei valori per anni
In media:
5.804
Minima:
2.192
1 gen 2015 anni
Massimo:
12.931
1 gen 2005 anni
Alla data di osservazione
Valore
Variazione assoluta
La variazione rispetto al valore precedente
1 gen 1996 anni
4.685
+4.685
0.0%
1 gen 1997 anni
5.675
+0.99
21.14%
1 gen 1998 anni
5.526
-0.149
-2.62%
1 gen 1999 anni
4.378
-1.149
-20.78%
1 gen 2000 anni
8.439
+4.062
92.78%
1 gen 2001 anni
6.63
-1.809
-21.44%
1 gen 2002 anni
8.483
+1.853
27.95%
1 gen 2003 anni
9.537
+1.054
12.43%
1 gen 2004 anni
10.655
+1.118
11.72%
1 gen 2005 anni
12.931
+2.276
21.36%
1 gen 2006 anni
7.886
-5.045
-39.02%
1 gen 2007 anni
5.729
-2.157
-27.36%
1 gen 2008 anni
4.902
-0.827
-14.43%
1 gen 2009 anni
4.197
-0.705
-14.38%
1 gen 2010 anni
3.414
-0.783
-18.66%
1 gen 2011 anni
3.681
+0.267
7.82%
1 gen 2012 anni
2.244
-1.437
-39.03%
1 gen 2013 anni
2.533
+0.289
12.87%
1 gen 2014 anni
2.365
-0.168
-6.63%
1 gen 2015 anni
2.192
-0.173
-7.3%
Classificazione dei paesi secondo i statistiche attuali per anni