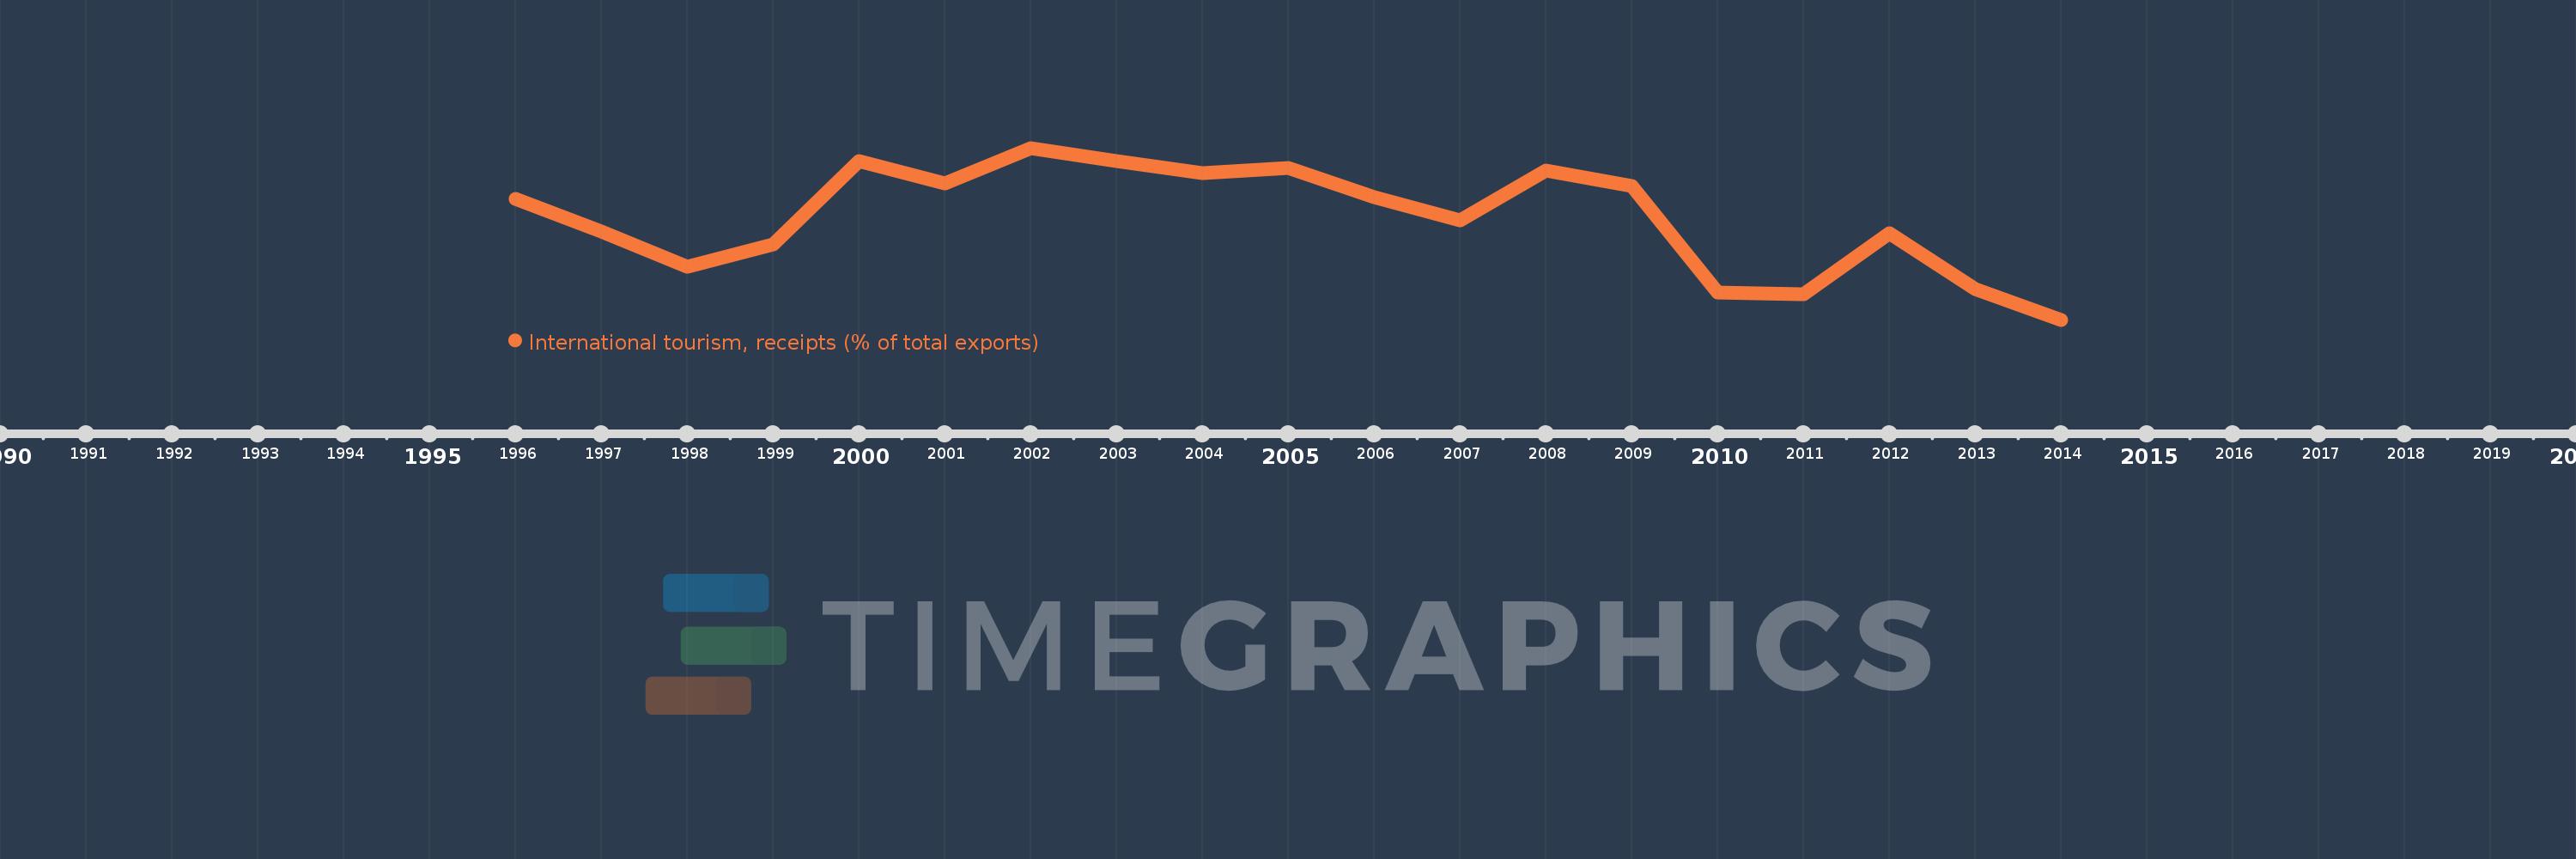
Questa scala temporale mostra un grafico dal 1996 anno al 2014 anno. Benin. I dati fino ad 1995 anno non disponibili. Il numero di osservazioni attuali secondo i date: 19.
La fonte (nome):
Indicatori dello sviluppo mondiale
La fonte (organizzazione):
World Tourism Organization, Yearbook of Tourism Statistics, Compendium of Tourism Statistics and data files, and IMF and World Bank exports estimates.
Categorie:
Private Sector, Trade
sono stati aggiornati
23 apr 2017 anni
Indicatori delle variazioni dei valori per anni
In media:
12.886
Minima:
7.732
1 gen 2014 anni
Massimo:
16.423
1 gen 2002 anni
Alla data di osservazione
Valore
Variazione assoluta
La variazione rispetto al valore precedente
1 gen 1996 anni
13.838
+13.838
0.0%
1 gen 1997 anni
12.188
-1.65
-11.92%
1 gen 1998 anni
10.407
-1.781
-14.61%
1 gen 1999 anni
11.534
+1.127
10.83%
1 gen 2000 anni
15.778
+4.244
36.79%
1 gen 2001 anni
14.648
-1.129
-7.16%
1 gen 2002 anni
16.423
+1.774
12.11%
1 gen 2003 anni
15.75
-0.673
-4.1%
1 gen 2004 anni
15.13
-0.62
-3.94%
1 gen 2005 anni
15.417
+0.287
1.9%
1 gen 2006 anni
13.953
-1.464
-9.5%
1 gen 2007 anni
12.766
-1.187
-8.51%
1 gen 2008 anni
15.301
+2.535
19.86%
1 gen 2009 anni
14.501
-0.8
-5.23%
1 gen 2010 anni
9.09
-5.411
-37.31%
1 gen 2011 anni
9.011
-0.079
-0.87%
1 gen 2012 anni
12.094
+3.083
34.22%
1 gen 2013 anni
9.272
-2.822
-23.33%
1 gen 2014 anni
7.732
-1.541
-16.62%
Classificazione dei paesi secondo i statistiche attuali per anni