29
/it/
it
AIzaSyAYiBZKx7MnpbEhh9jyipgxe19OcubqV5w
April 1, 2024
152694
Hungary
HUN
true
2
1
International tourism, receipts (% of total exports)
2015,2014,2013,2012,2011,2010,2009,2008,2007,2006,2005,2004,2003,2002,2001,2000,1999,1998,1997,1996
Download
Biblioteca di statistiche globali →Hungary →

International tourism, receipts (% of total exports)

Queste statistiche in altri paesi:
AfghanistanAlbaniaAlgeriaAngolaAntigua and BarbudaArab WorldArgentinaArmeniaArubaAustraliaAustriaAzerbaijanBahamas, TheBahrainBangladeshBarbadosBelarusBelgiumBelizeBeninBermudaBhutanBoliviaBosnia and HerzegovinaBotswanaBrazilBrunei DarussalamBulgariaBurkina FasoBurundiCabo VerdeCambodiaCameroonCanadaCaribbean small statesCentral Europe and the BalticsChileChinaColombiaComorosCongo, Dem. Rep.Congo, Rep.Costa RicaCote d'IvoireCroatiaCuracaoCyprusCzech RepublicDenmarkDjiboutiDominicaDominican RepublicEarly-demographic dividendEast Asia & PacificEast Asia & Pacific (excluding high income)East Asia & Pacific (IDA & IBRD countries)EcuadorEgypt, Arab Rep.El SalvadorEquatorial GuineaEritreaEstoniaEthiopiaEuro areaEurope & Central AsiaEurope & Central Asia (excluding high income)Europe & Central Asia (IDA & IBRD countries)European UnionFijiFinlandFragile and conflict affected situationsFranceFrench PolynesiaGabonGambia, TheGeorgiaGermanyGhanaGreeceGrenadaGuatemalaGuineaGuinea-BissauGuyanaHaitiHeavily indebted poor countries (HIPC)High incomeHondurasHong Kong SAR, ChinaHungaryIBRD onlyIcelandIDA & IBRD totalIDA blendIDA onlyIDA totalIndiaIndonesiaIran, Islamic Rep.IraqIrelandIsraelItalyJamaicaJapanJordanKazakhstanKenyaKiribatiKorea, Rep.KuwaitKyrgyz RepublicLao PDRLate-demographic dividendLatin America & Caribbean Latin America & Caribbean (excluding high income)Latin America & the Caribbean (IDA & IBRD countries)LatviaLeast developed countries: UN classificationLebanonLesothoLiberiaLibyaLithuaniaLow & middle incomeLow incomeLower middle incomeLuxembourgMacao SAR, ChinaMacedonia, FYRMadagascarMalawiMalaysiaMaldivesMaliMaltaMarshall IslandsMauritaniaMauritiusMexicoMicronesia, Fed. Sts.Middle East & North AfricaMiddle East & North Africa (excluding high income)Middle East & North Africa (IDA & IBRD countries)Middle incomeMoldovaMongoliaMontenegroMoroccoMozambiqueMyanmarNamibiaNepalNetherlandsNew CaledoniaNicaraguaNigerNigeriaNorth AmericaNorwayOECD membersOmanOther small statesPacific island small statesPakistanPalauPanamaPapua New GuineaParaguayPeruPhilippinesPolandPortugalPost-demographic dividendPre-demographic dividendQatarRomaniaRussian FederationRwandaSamoaSao Tome and PrincipeSaudi ArabiaSenegalSerbiaSeychellesSierra LeoneSingaporeSint Maarten (Dutch part)Slovak RepublicSloveniaSmall statesSolomon IslandsSouth AfricaSouth AsiaSouth Asia (IDA & IBRD)SpainSri LankaSt. Kitts and NevisSt. LuciaSt. Vincent and the GrenadinesSub-Saharan Africa Sub-Saharan Africa (excluding high income)Sub-Saharan Africa (IDA & IBRD countries)SudanSurinameSwazilandSwedenSwitzerlandSyrian Arab RepublicTajikistanTanzaniaThailandTimor-LesteTogoTongaTrinidad and TobagoTunisiaTurkeyTuvaluUgandaUkraineUnited KingdomUnited StatesUpper middle incomeUruguayVanuatuVenezuela, RBVietnamWest Bank and GazaWorldYemen, Rep.ZambiaZimbabwe
Linea del tempo:
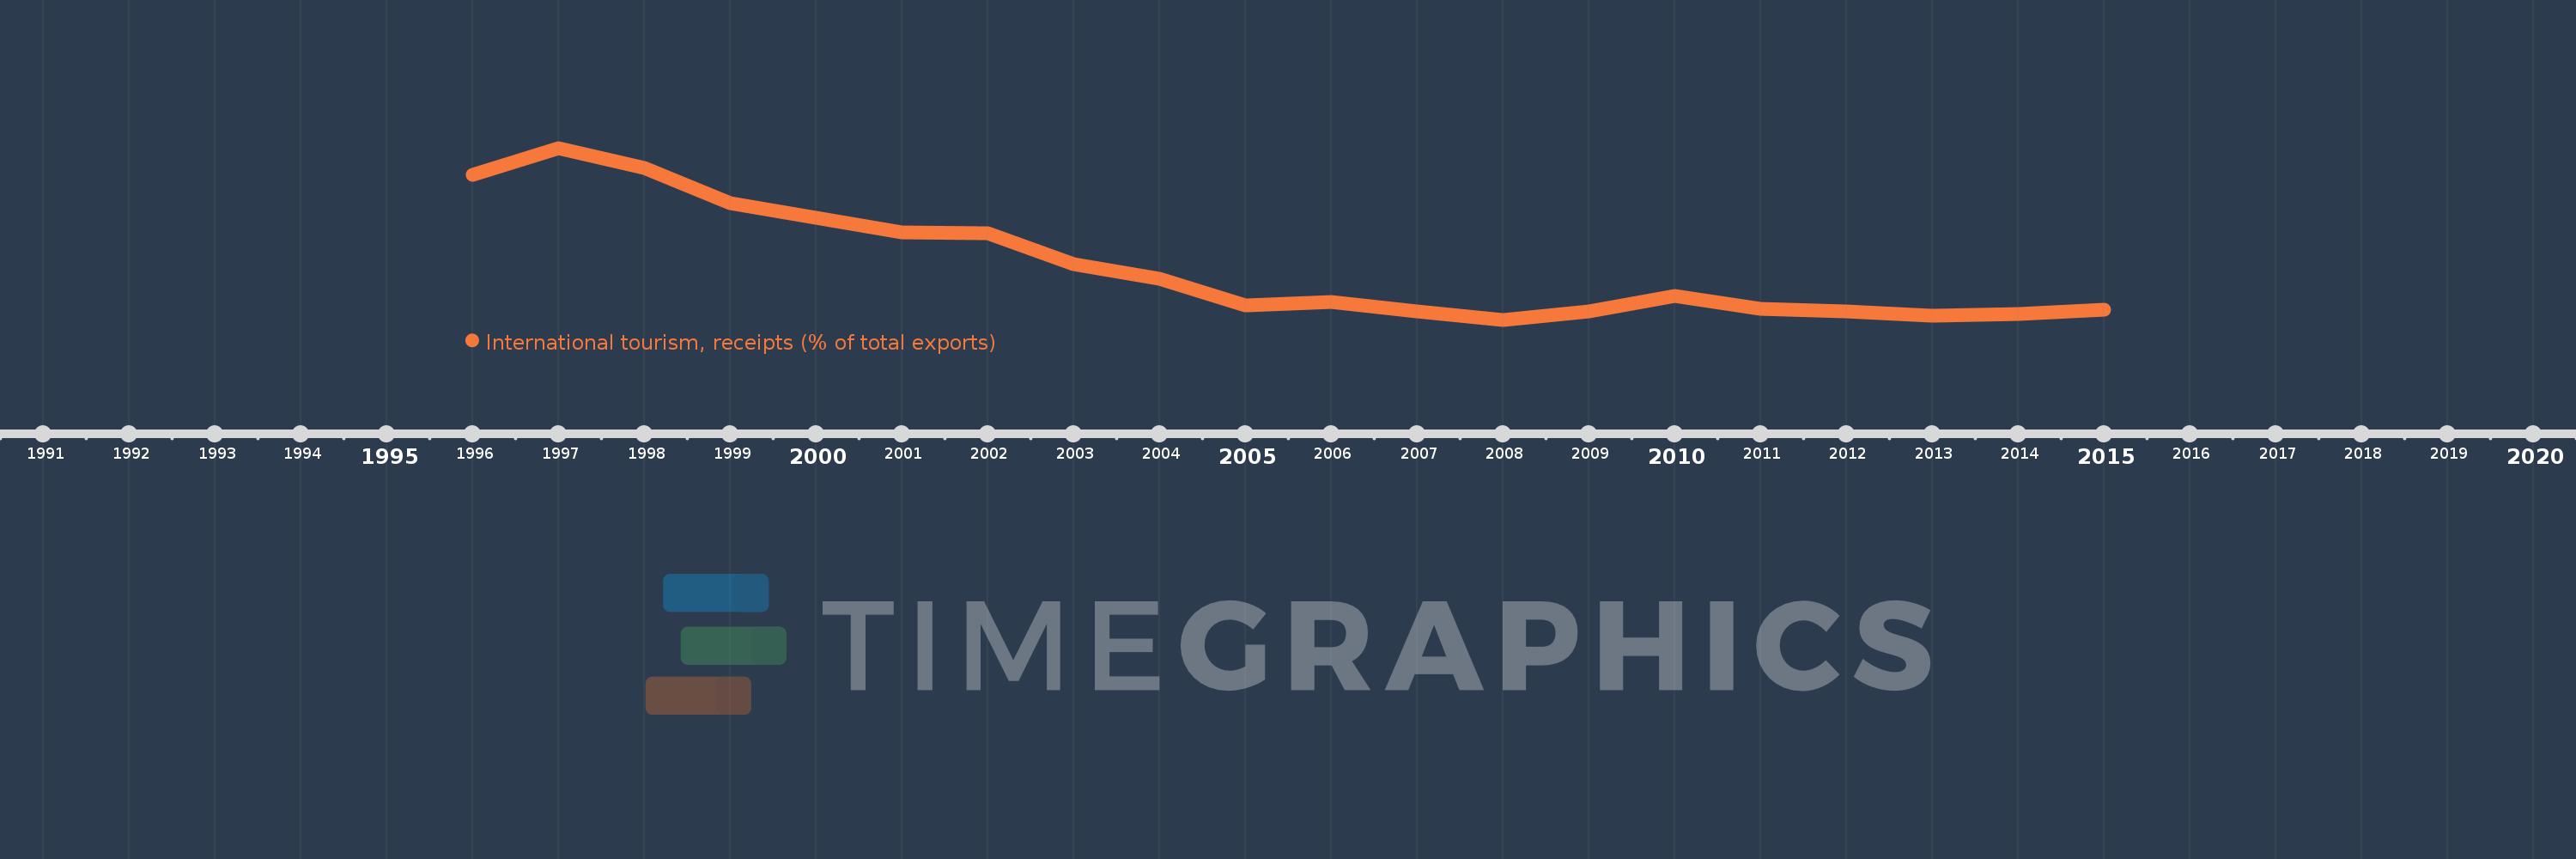
Questa scala temporale mostra un grafico dal 1996 anno al 2015 anno. Hungary. I dati fino ad 1995 anno non disponibili. Il numero di osservazioni attuali secondo i date: 20.
La fonte (nome):
Indicatori dello sviluppo mondiale
La fonte (organizzazione):
World Tourism Organization, Yearbook of Tourism Statistics, Compendium of Tourism Statistics and data files, and IMF and World Bank exports estimates.
Categorie:
Private Sector, Trade
sono stati aggiornati
23 apr 2017 anni
Indicatori delle variazioni dei valori per anni
In media:
9.546
Minima:
5.276
1 gen 2008 anni
Massimo:
19.006
1 gen 1997 anni
Alla data di osservazione
Valore
Variazione assoluta
La variazione rispetto al valore precedente
1 gen 1996 anni
16.847
+16.847
0.0%
1 gen 1997 anni
19.006
+2.158
12.81%
1 gen 1998 anni
17.402
-1.604
-8.44%
1 gen 1999 anni
14.604
-2.797
-16.08%
1 gen 2000 anni
13.422
-1.183
-8.1%
1 gen 2001 anni
12.258
-1.164
-8.67%
1 gen 2002 anni
12.173
-0.085
-0.69%
1 gen 2003 anni
9.721
-2.452
-20.14%
1 gen 2004 anni
8.56
-1.162
-11.95%
1 gen 2005 anni
6.423
-2.137
-24.97%
1 gen 2006 anni
6.679
+0.256
3.99%
1 gen 2007 anni
5.967
-0.712
-10.66%
1 gen 2008 anni
5.276
-0.691
-11.57%
1 gen 2009 anni
5.962
+0.686
13.0%
1 gen 2010 anni
7.16
+1.198
20.1%
1 gen 2011 anni
6.16
-1.0
-13.97%
1 gen 2012 anni
5.921
-0.239
-3.87%
1 gen 2013 anni
5.565
-0.357
-6.02%
1 gen 2014 anni
5.757
+0.193
3.46%
1 gen 2015 anni
6.052
+0.294
5.11%
Classificazione dei paesi secondo i statistiche attuali per anni

Commenti:

Inviare
PremiumAbout & FeedbackAccordoPrivatezza
logo
© 2022 Selected Technologies LLC – Morgan Hill, California