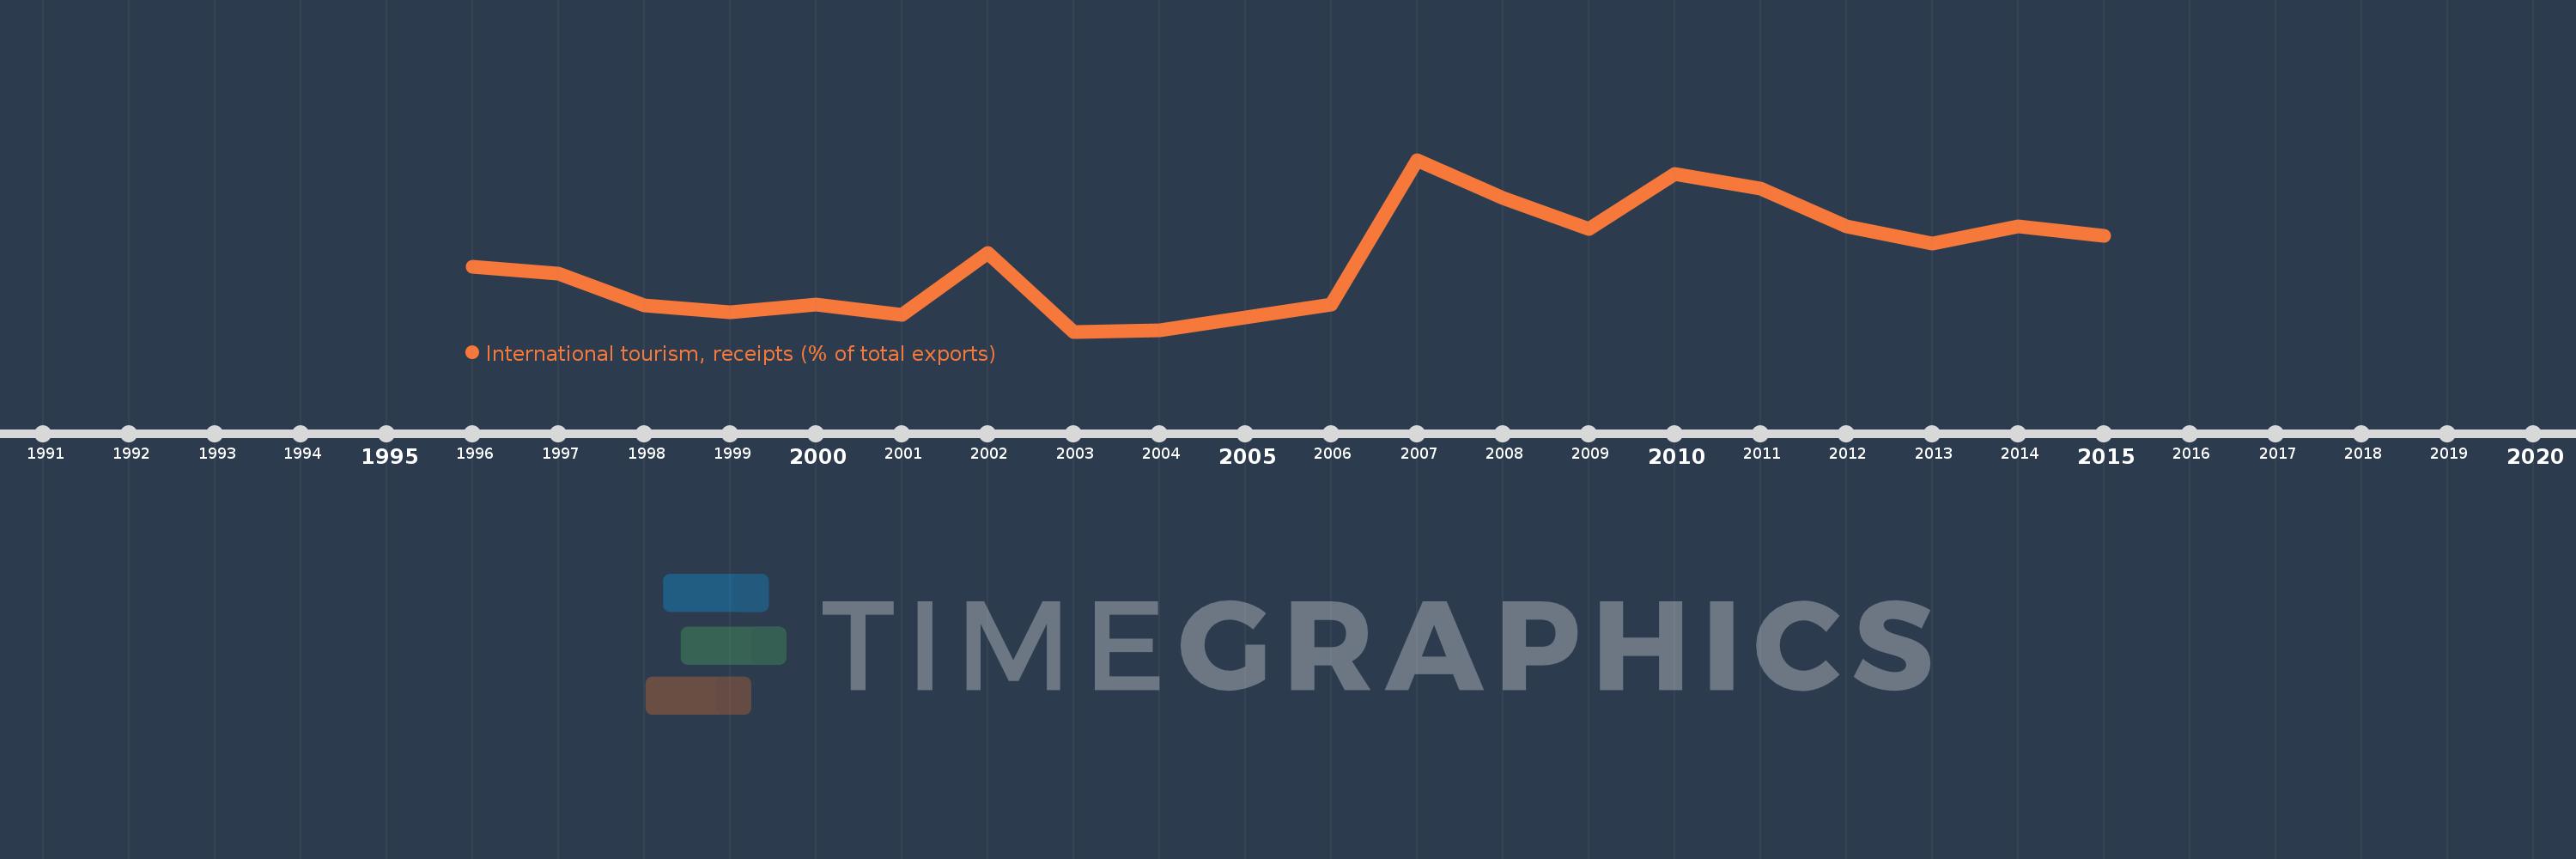
Questa scala temporale mostra un grafico dal 1996 anno al 2015 anno. Solomon Islands. I dati fino ad 1995 anno non disponibili. Il numero di osservazioni attuali secondo i date: 20.
La fonte (nome):
Indicatori dello sviluppo mondiale
La fonte (organizzazione):
World Tourism Organization, Yearbook of Tourism Statistics, Compendium of Tourism Statistics and data files, and IMF and World Bank exports estimates.
Categorie:
Private Sector, Trade
sono stati aggiornati
23 apr 2017 anni
Indicatori delle variazioni dei valori per anni
In media:
8.887
Minima:
1.618
1 gen 2003 anni
Massimo:
19.007
1 gen 2007 anni
Alla data di osservazione
Valore
Variazione assoluta
La variazione rispetto al valore precedente
1 gen 1996 anni
8.139
+8.139
0.0%
1 gen 1997 anni
7.454
-0.685
-8.41%
1 gen 1998 anni
4.277
-3.177
-42.62%
1 gen 1999 anni
3.606
-0.671
-15.69%
1 gen 2000 anni
4.392
+0.786
21.79%
1 gen 2001 anni
3.292
-1.1
-25.05%
1 gen 2002 anni
9.602
+6.31
191.7%
1 gen 2003 anni
1.618
-7.983
-83.15%
1 gen 2004 anni
1.741
+0.123
7.6%
1 gen 2005 anni
3.023
+1.282
73.6%
1 gen 2006 anni
4.378
+1.355
44.83%
1 gen 2007 anni
19.007
+14.629
334.13%
1 gen 2008 anni
15.138
-3.869
-20.35%
1 gen 2009 anni
12.028
-3.11
-20.55%
1 gen 2010 anni
17.538
+5.51
45.81%
1 gen 2011 anni
16.093
-1.444
-8.24%
1 gen 2012 anni
12.269
-3.825
-23.77%
1 gen 2013 anni
10.569
-1.7
-13.86%
1 gen 2014 anni
12.293
+1.724
16.31%
1 gen 2015 anni
11.29
-1.003
-8.16%
Classificazione dei paesi secondo i statistiche attuali per anni