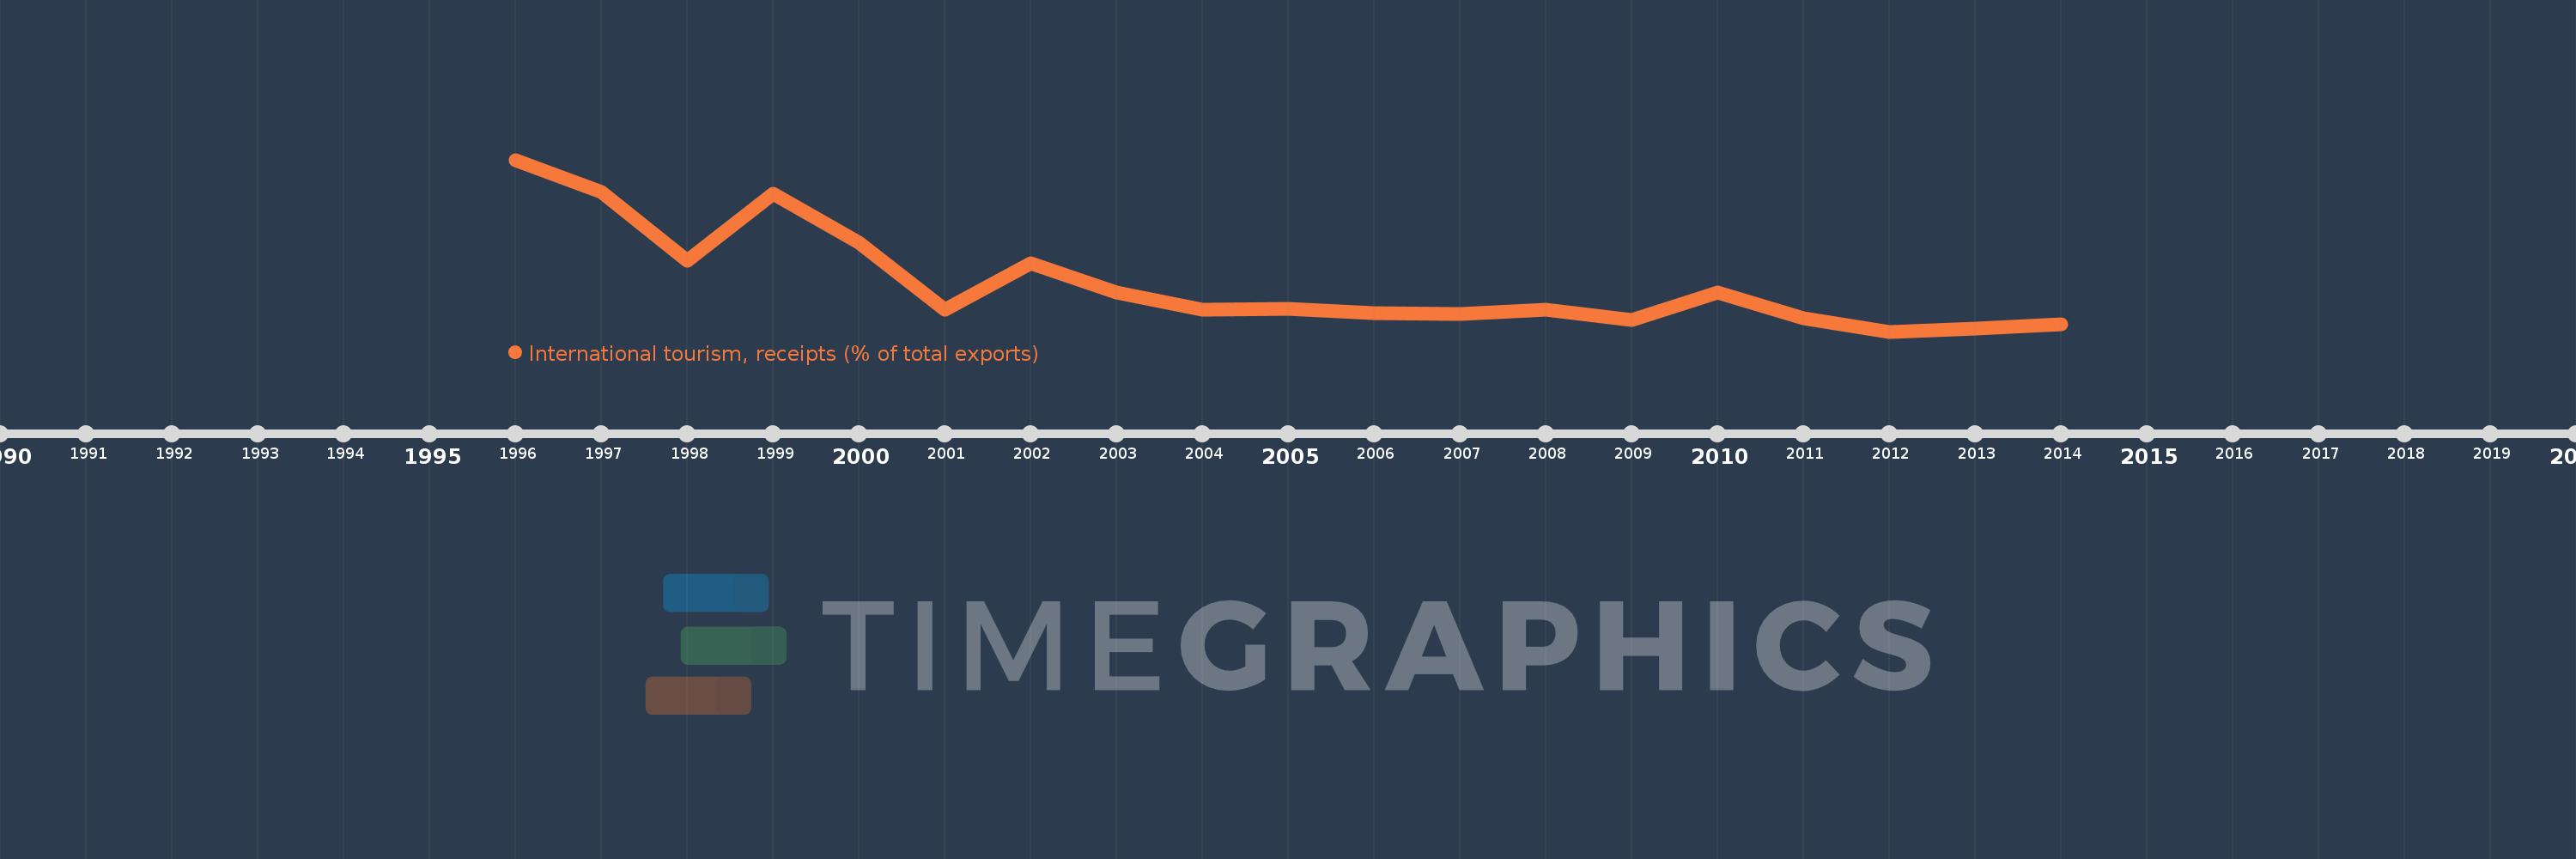
Questa scala temporale mostra un grafico dal 1996 anno al 2014 anno. Venezuela, RB. I dati fino ad 1995 anno non disponibili. Il numero di osservazioni attuali secondo i date: 19.
La fonte (nome):
Indicatori dello sviluppo mondiale
La fonte (organizzazione):
World Tourism Organization, Yearbook of Tourism Statistics, Compendium of Tourism Statistics and data files, and IMF and World Bank exports estimates.
Categorie:
Private Sector, Trade
sono stati aggiornati
23 apr 2017 anni
Indicatori delle variazioni dei valori per anni
In media:
1.952
Minima:
0.842
1 gen 2012 anni
Massimo:
4.794
1 gen 1996 anni
Alla data di osservazione
Valore
Variazione assoluta
La variazione rispetto al valore precedente
1 gen 1996 anni
4.794
+4.794
0.0%
1 gen 1997 anni
4.059
-0.736
-15.35%
1 gen 1998 anni
2.474
-1.585
-39.05%
1 gen 1999 anni
4.02
+1.546
62.5%
1 gen 2000 anni
2.881
-1.138
-28.32%
1 gen 2001 anni
1.351
-1.53
-53.11%
1 gen 2002 anni
2.414
+1.063
78.67%
1 gen 2003 anni
1.741
-0.673
-27.87%
1 gen 2004 anni
1.345
-0.397
-22.77%
1 gen 2005 anni
1.358
+0.014
1.01%
1 gen 2006 anni
1.265
-0.093
-6.85%
1 gen 2007 anni
1.256
-0.009
-0.75%
1 gen 2008 anni
1.349
+0.093
7.4%
1 gen 2009 anni
1.117
-0.232
-17.21%
1 gen 2010 anni
1.739
+0.623
55.76%
1 gen 2011 anni
1.155
-0.584
-33.58%
1 gen 2012 anni
0.842
-0.314
-27.15%
1 gen 2013 anni
0.904
+0.062
7.38%
1 gen 2014 anni
1.018
+0.114
12.64%
Classificazione dei paesi secondo i statistiche attuali per anni